
Gold Price Forecast for Today, Tomorrow, Next Week, and 30-Day Forecast

Gold price forecast and analysis for today, tomorrow, next week and the next 30 days, including key technical levels and market drivers.
Gold is one of the most actively traded financial instruments because of its high liquidity and sensitivity to interest rates, the US dollar, inflation, and global risk. XAU/USD analysis helps traders assess the current market direction, key support and resistance levels, and potential price scenarios.
Key Takeaways
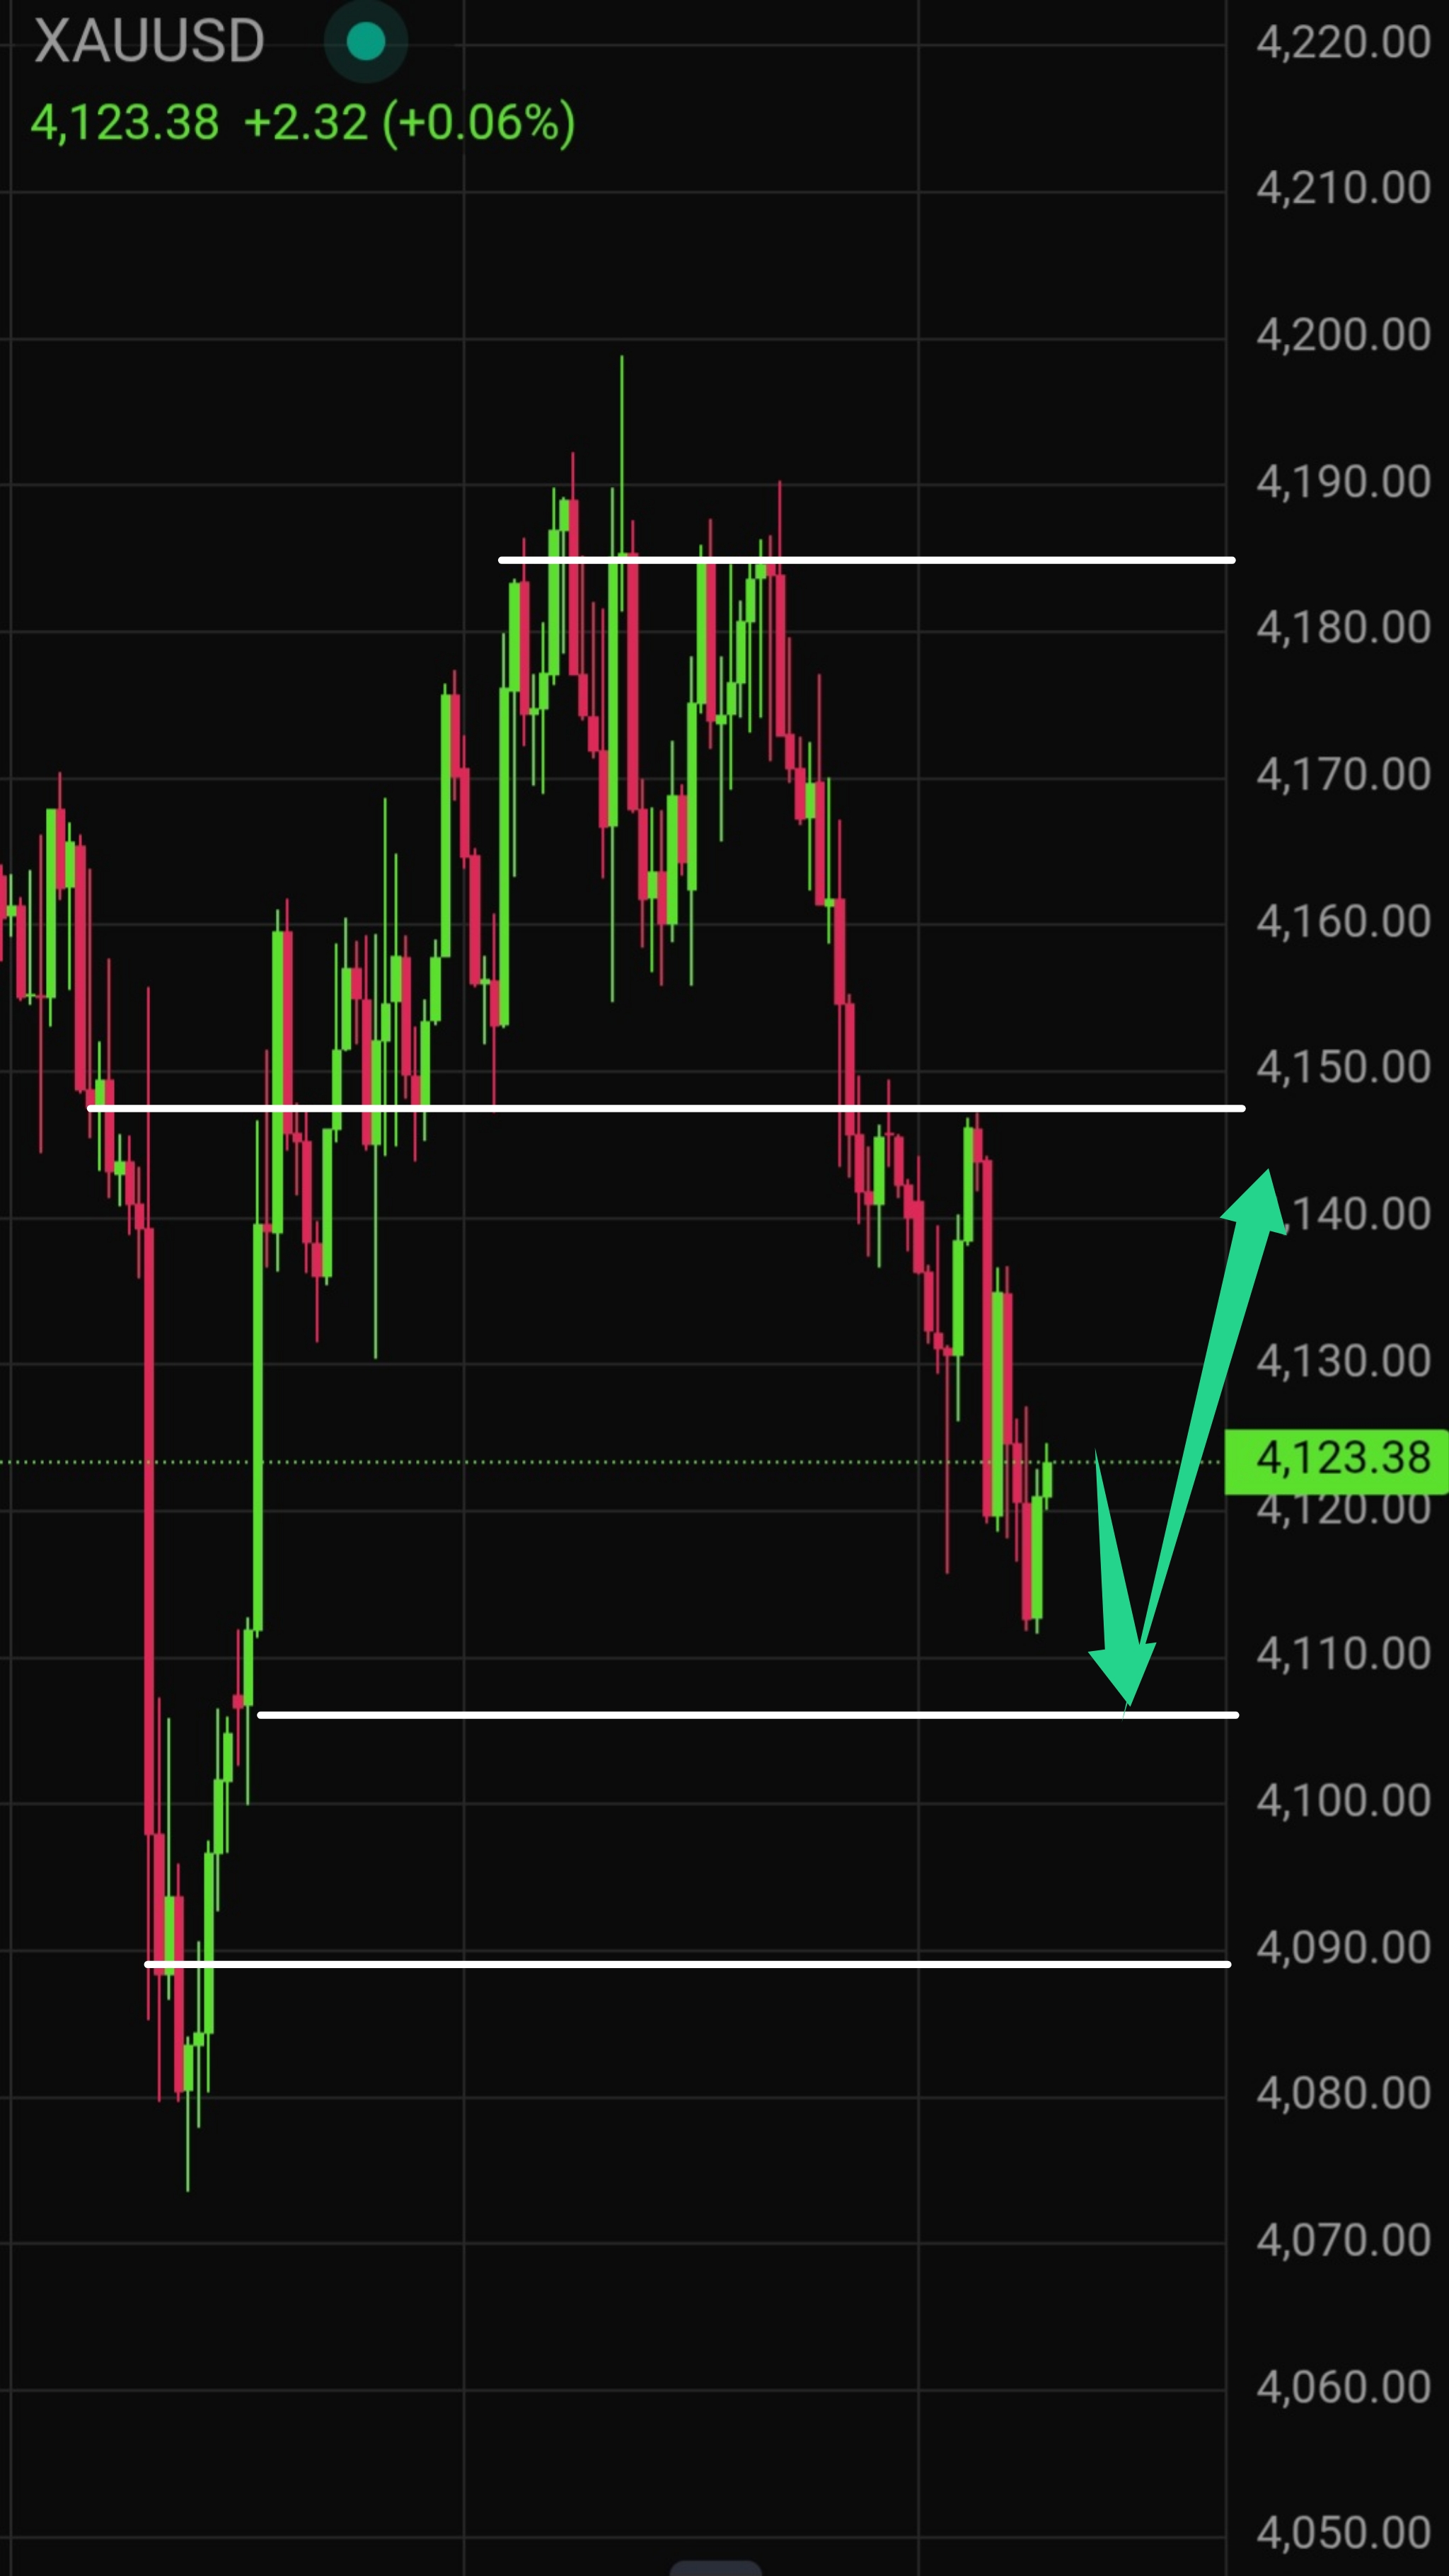
Intraday: Look for long entries on dips into the $4,105–4,110 demand zone with stops below $4,100. Avoid aggressive shorts while this area holds.
The base scenario: Rebound from $4,105–4,110 toward $4,140–4,150.
The alternative scenario: Break below $4,100 that opens a deeper correction.
This week: Mild supportive bias if yields and the dollar ease; otherwise, gold is likely to remain range-bound.
30-day outlook: Consolidation expected between roughly $4,150–4,200, with upside potential toward $4,240 if protective demand strengthens and downside risk toward $4,100 if US yields keep rising.
Latest Gold (XAU/USD) Technical Analysis for Today
Gold price today is testing a key demand area after recent selling pressure.
On the H1 chart, price appears to be making a final probe of the $4,105–4,110 zone, from which an impulsive move toward $4,140–4,150 could develop
RSI: 39,02
MACD: Bearish
MA: 4,127
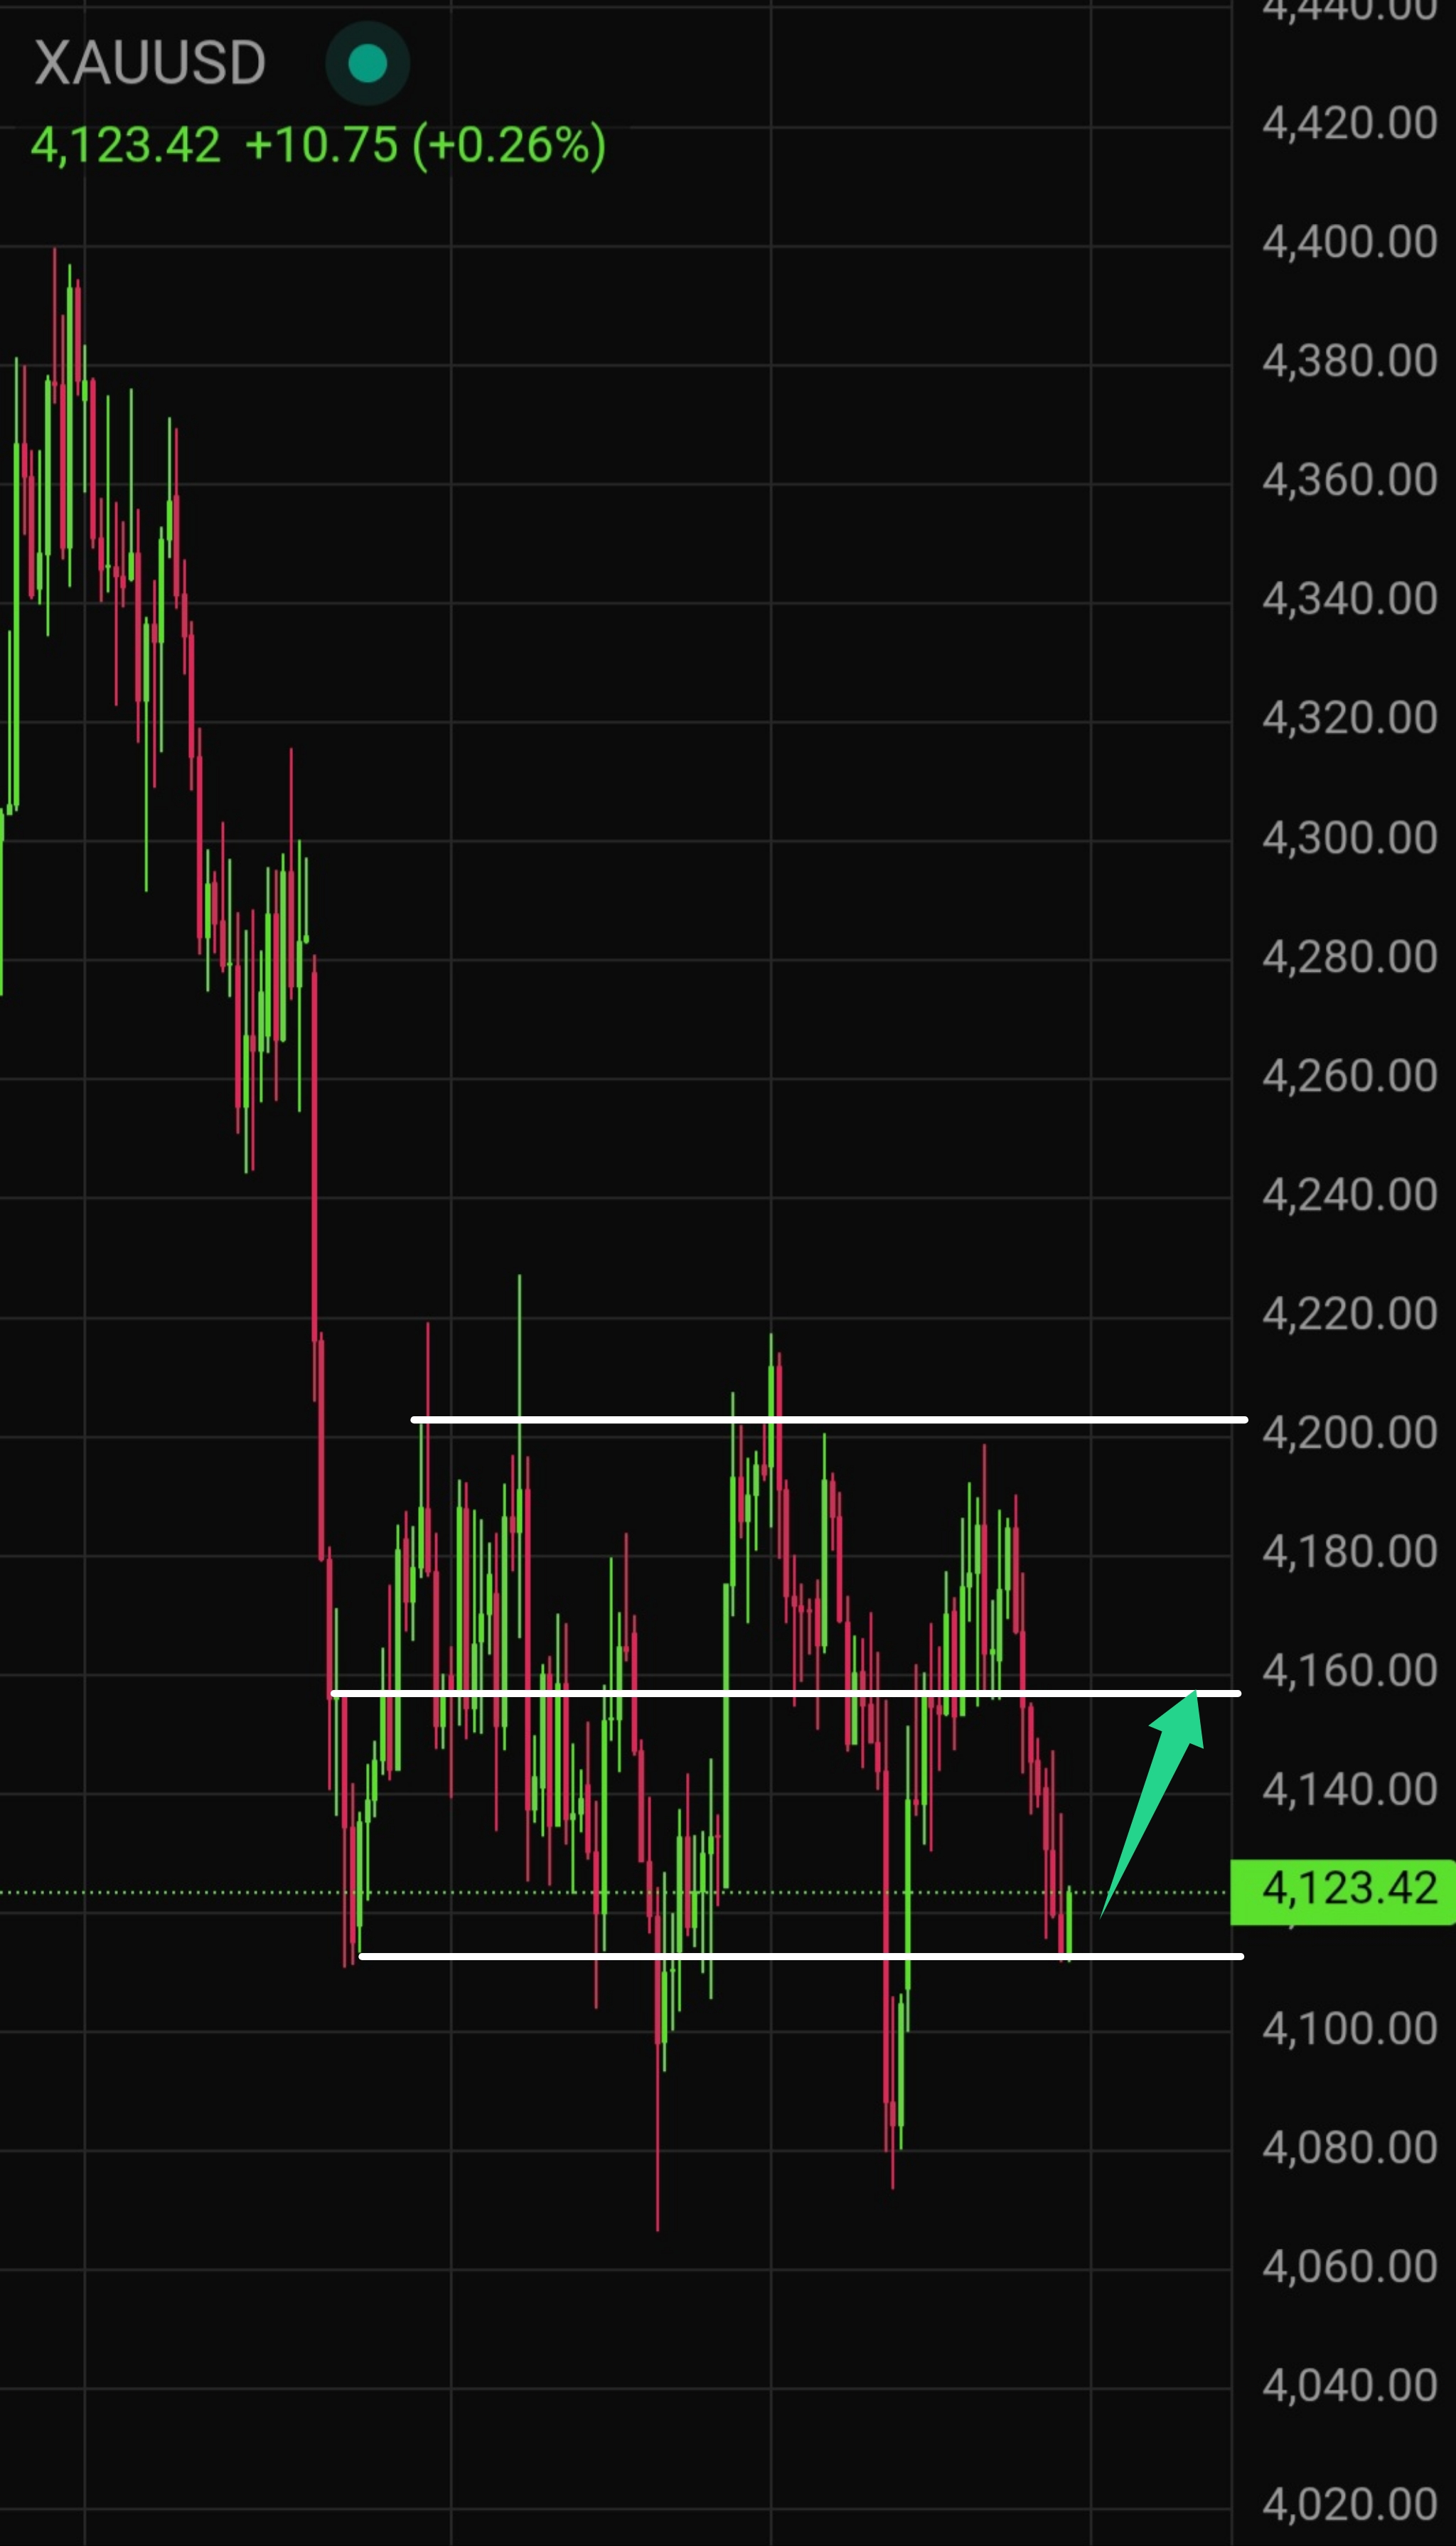
The H4 picture already shows the first signs of buyer interest near $4,110; a confirmed bounce would create solid conditions for a push toward $4,160.
Overall, the gold technical outlook remains constructive as long as the demand zone holds.
RSI: 40,23
MACD: Bullish
MA: 4,141
Key gold support and resistance levels:
- Supports: $4,105–4,110 / $4,100
- Resistances: $4,140–4,150 / $4,160
Gold (XAU/USD) Trading Plan for Today
- Base scenario: Rebound from the $4,105–4,110 demand zone toward $4,140–4,150.
- Alternative scenario: Failure below $4,100 that extends the correction.
- Stops for long positions should sit below $4,100.
This keeps the latest XAUUSD technical analysis focused on the critical support area.
Gold (XAU/USD) Live Price Today
Spot gold declined as December COMEX futures lost 0.5 % and closed at $4,160.10.
A stronger dollar and rising 10-year Treasury yields increased the opportunity cost of holding a non-yielding asset, putting pressure on the XAUUSD live price.
Higher oil prices keep inflation risks alive, which could reinforce expectations of firmer Fed policy and add further headwinds. At the same time, geopolitical tensions continue to support safe-haven demand.
Today’s main reference points are the dollar, bond yields and US housing data. Strong numbers may weigh on gold; weaker prints could offer relief.

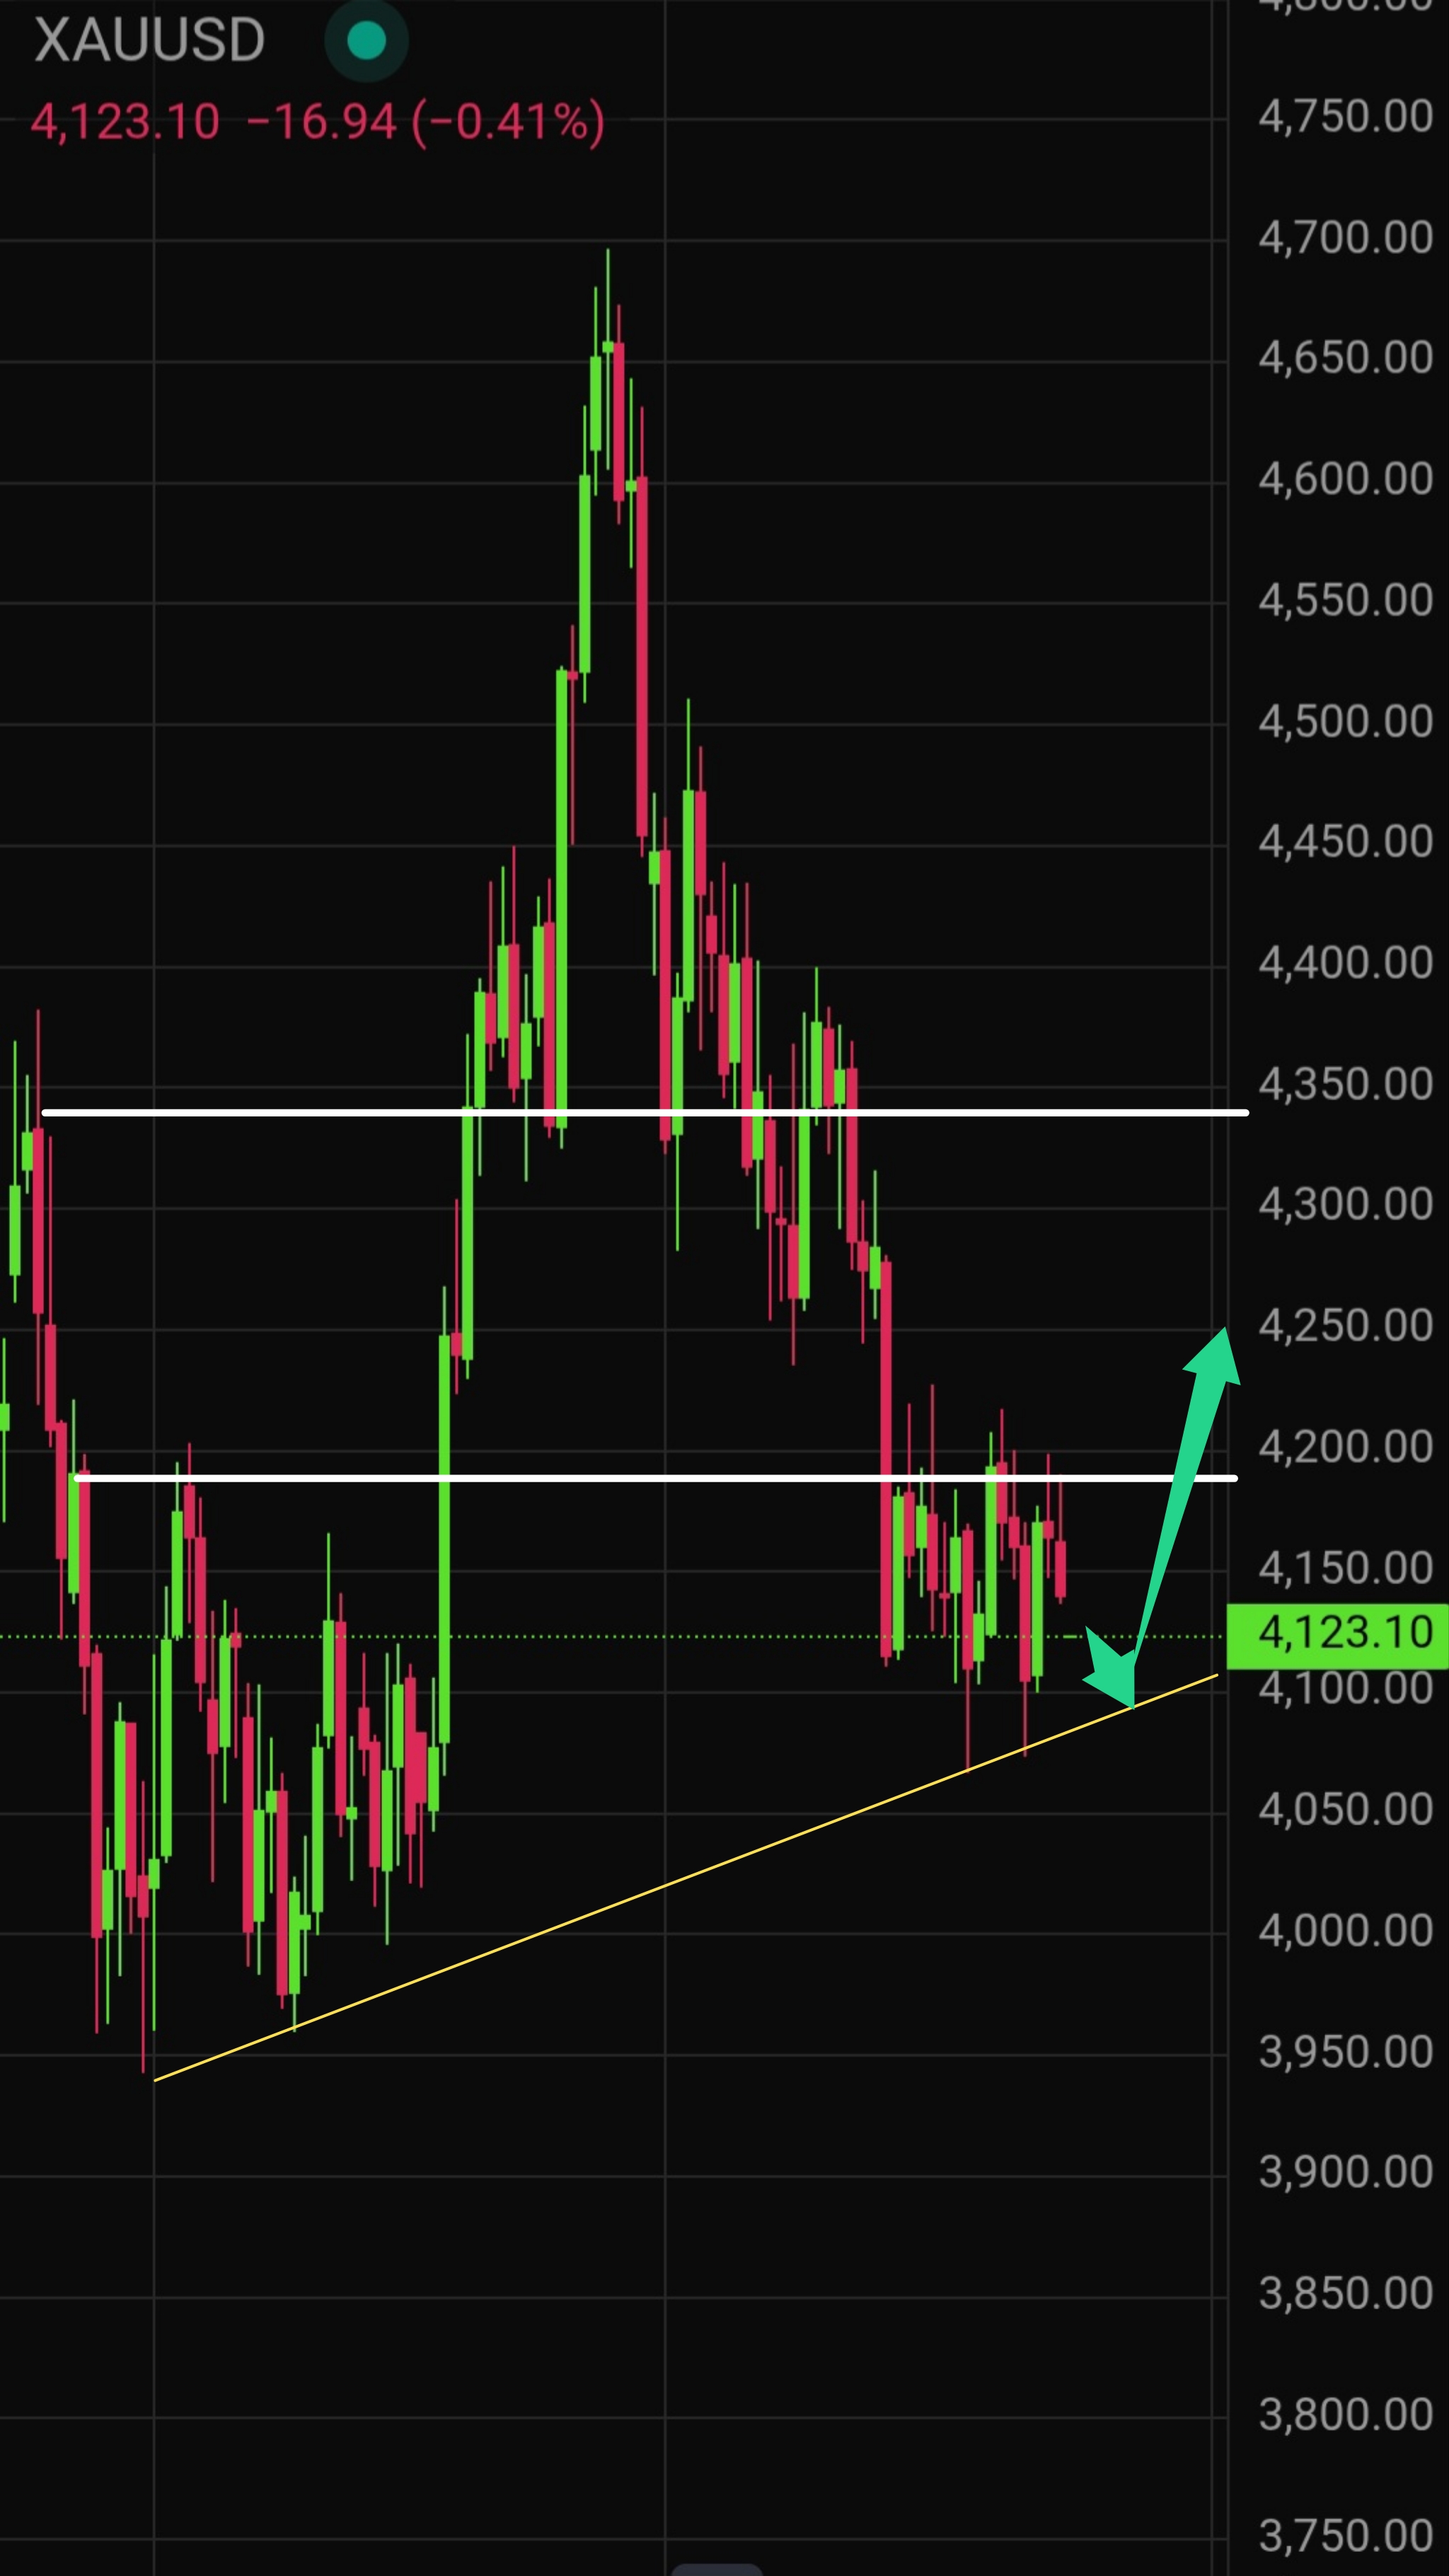
On the daily timeframe, accumulation continues ahead of a potential impulsive advance toward the $4,300–4,350 region.
Gold (XAU/USD) Price Forecast for Tomorrow
After confirmation of demand in the $4,105–4,110 zone, price is expected to challenge the $4,150–4,160 resistance area.
Will gold go up tomorrow? Yes — the current setup looks like a bullish consolidation with upside priority.
| Date | October 20, 2026 |
| Minimum | $4,111 |
| Average | $4,124 |
| Maximum |
$4,147 |
Gold (XAU/USD) Price Forecast for This Week
Key data releases include
- U.S. building permits (20 October)
- Weekly jobless claims (22 October)
- Preliminary U.S. PMI (23 October).
Strong figures could lift the dollar and yields, while softer readings would support gold through easier policy expectations.
The gold weekly outlook remains cautiously constructive thanks to lower oil prices and yields, yet any renewed upside surprise in inflation data could quickly erode that support. Traders should watch Treasury yields and the dollar closely.
Overall, the gold price this week is likely to stay range-bound unless $4,200 is cleared decisively.
| Date range | October 19–October 23, 2026 |
| Minimum | $4,111 |
| Average | $4,150 |
| Maximum | $4,190 |
Gold (XAU/USD) Price Forecast for the Next 30 Days
Major calendar items are:
- The Fed meeting (27–28 Oct)
- Q3 GDP plus Personal Income/Outlays and PCE (29 Oct),
- Employment Cost Index (30 Oct).
Supply-side developments are also relevant: producing countries are increasingly retaining gold domestically. Laos is expanding its refining capacity, Indonesia has introduced export duties of up to 15%, China continues to restrict exports while its central bank buys, and several African nations are purchasing their own output. More gold is therefore being held outside international markets. At the same time, central banks continue to diversify away from the dollar. Goldman Sachs maintains a $5,400 year-end 2027 target; higher rates may make the path uneven, yet the long-term view can still support dips.
The gold price outlook next month, XAU/USD 30-day forecast, remains two-directional. Elevated energy-driven inflation and geopolitical uncertainty can support gold as a safe-haven asset. Conversely, a persistently hawkish Fed and firm CPI/PPI readings would lift yields and the dollar, capping upside.
The central sequence remains the recent CPI → today’s PPI/Retail Sales → the 28 October Fed decision.
| Date | Event | Potential impact |
| October 7 | FOMC Minutes | High |
|
October, 14 |
U.S. CPI | High |
| October 15 | PPI and Retail Sales | High |
| October 16 | Import/Export Price Indexes | High |
| October 27-28 | the Fed meeting | High |
30-Day Scenarios
Base case remains consolidation between $4,150 and $4,200.
A bullish scenario targets $4,240.
A bearish scenario would open a decline toward $4,100.
Gold Price Analysis and Forecasting Methodology
Our gold forecast methodology combines technical analysis, fundamental analysis, and market sentiment. Technical analysis evaluates price action, trends, support and resistance, RSI, MACD, and other indicators across multiple timeframes. Fundamental analysis considers interest rates, inflation, the US dollar, Treasury yields, and major economic events. Sentiment analysis helps identify changes in investor positioning and risk appetite. The final forecast represents a scenario-based assessment of potential market movements and is not a guarantee of future prices.
Is Gold a Good Investment?
Is gold a good investment? Gold can play an important role in a diversified portfolio because it may provide diversification and help hedge against certain market and economic risks. Investors should consider their investment horizon, risk tolerance, and current market conditions before making an investment decision.
You can start trading gold and other financial instruments with Investizo.
Summary
Gold is testing a critical demand zone near $4,105–4,110 after recent pressure from a firmer dollar and higher yields. A confirmed rebound opens the path toward $4,140–4,160, while a break below $4,100 would signal deeper correction risk. Near-term direction hinges on US data, yields and the late-October Fed meeting, keeping the overall bias constructive but event-sensitive.
Gold (XAU/USD) Price Forecast FAQs
What is the current price of XAU/USD now?
October 21, 2026
$
Will Gold Go Up Tomorrow?
Yes, the priority scenario is a rebound. If buyers successfully defend the $4,105–4,110 demand zone, gold is expected to challenge the $4,140–4,160 resistance area in the next session.
Will Gold Rise or Fall Next Week?
A mild rise or range-bound move is more likely if US yields and the dollar ease. Stronger labour or PMI data could keep gold under pressure, so the bias stays constructive but data-dependent.
What Could Trigger a Short-Term Drop in Gold (XAU/USD)?
A further rise in US Treasury yields, a stronger dollar, or unexpectedly firm US housing and labour data would increase the opportunity cost of holding gold and could push price below the $4,100 support.
How Do We Do Gold Technical Analysis?
We analyze price action, trends, support and resistance levels, moving averages, RSI and MACD across H1, H4 and higher timeframes. Major events that can affect XAU/USD volatility are also considered.
How to Trade Gold Technical Analysis?
Technical analysis can help identify potential entry points, targets and stop-loss levels. A trading setup should be based on confirmation of the market scenario and predefined risk rather than a single indicator.
Nikolai Krishtopov is a Market Analyst at Investizo with more than 15 years of experience in the financial markets industry and over a decade of trading experience. His areas of focus include forex and crypto markets, technical analysis, intraday trading and market behaviour.
Award history
More about awards
2023—2025 - 8 awards archived