
Bitcoin Price Forecast for Today, Tomorrow, Next Week and 30-Day Forecast

Bitcoin's price tracks institutional demand, spot ETF flows, regulatory news and its correlation with the stock market, which is why traders follow BTC/USD so closely. This page gives our Bitcoin forecast from the price at 12 Nov 2026, 20:00 UTC, when Bitcoin trades at $71,454.
Bitcoin's price tracks institutional demand, spot ETF flows, regulatory news and its correlation with the stock market, which is why traders follow BTC/USD so closely. This page gives our Bitcoin forecast from the price at 12 Nov 2026, 20:00 UTC, when Bitcoin trades at $71,454.
Key Takeaways
- Bearish bias as of 12 Nov 2026, 20:00 UTC, with Bitcoin at $71,454, down 3.95% on the day and 5.65% on the week.
- Base case (1–3 days): sell a rebound into $73,439, target $71,000; a move above $74,346 invalidates it.
- Alternative: a breakdown through $70,909 targets $69,412, with the stop back above $71,907.
- Next day (13 Nov): our volatility range is $68,702–73,912 (−3.9%, +3.4%).
- This week to 15 Nov: range $66,996–75,500; the 30-day volatility range is $55,413–87,940 (−25.9%, +17.7%).
Latest Bitcoin Updates
- Nov 13, 00:25 UTC — Bitcoin ETF daily flows show Morgan Stanley's MSBT product received a $3.3 million inflow. — Farside Investors on X
- Nov 13, 00:17 UTC — Bipartisan SEC and CFTC nominees face a tight confirmation window in Congress, with potential inclusion in a year-end package; nominees have crypto regulatory experience. — Eleanor Terrett on X
- Nov 13, 00:00 UTC — Former White House Crypto Council official noted U.S. agencies previously stored cold wallets insecurely; Treasury is building a custody framework ahead of potential Bitcoin purchases or conversions. — Wu Blockchain on X
- Nov 12, 22:21 UTC — El Salvador purchased additional Bitcoin for its strategic reserve, increasing holdings to 7833 BTC valued at $559 million. — Bitcoin Magazine on X
- Nov 12, 21:18 UTC — The Bitcoin Fear & Greed Index has dropped to 28, entering fear territory. — Bitcoin Magazine on X
- Nov 12, 20:01 UTC — Former CFTC Chairman Chris Giancarlo says everything of value will be tokenized by 2040 and Bitcoin will have tremendous value. — Bitcoin Magazine on X
- Nov 12, 18:30 UTC — Cardone Capital purchased 20 BTC for $1.4 million during the recent dip. — Bitcoin Magazine on X
- Nov 12, 18:00 UTC — Michael Saylor says Bitcoin can resist AI attacks due to its limited features and strong security. — Bitcoin Magazine on X
Bitcoin (BTC/USD) Live Price Today
Live price: $70,936.75
As of 12 Nov 2026, 20:00 UTC, Bitcoin trades at $71,454, down 3.95% from the prior close at $74,393, inside a $71,240–74,542 day. US inflation ran hot on 10 Nov: the inflation rate rose 0.4% m/m against a 0.3% forecast, and core inflation rose 0.3% against 0.2% (BLS, 10 Nov). Payrolls on 6 Nov printed 165K against a 65K forecast, with unemployment at 4.1% (BLS, 6 Nov). The 10-year Treasury yield stood at 4.88% (Federal Reserve, 10 Nov). Lookonchain reported on X that Bitcoin ETFs recorded net outflows of 3,621 BTC, worth $262.8 million, on 12 Nov, which fits the selling pressure.

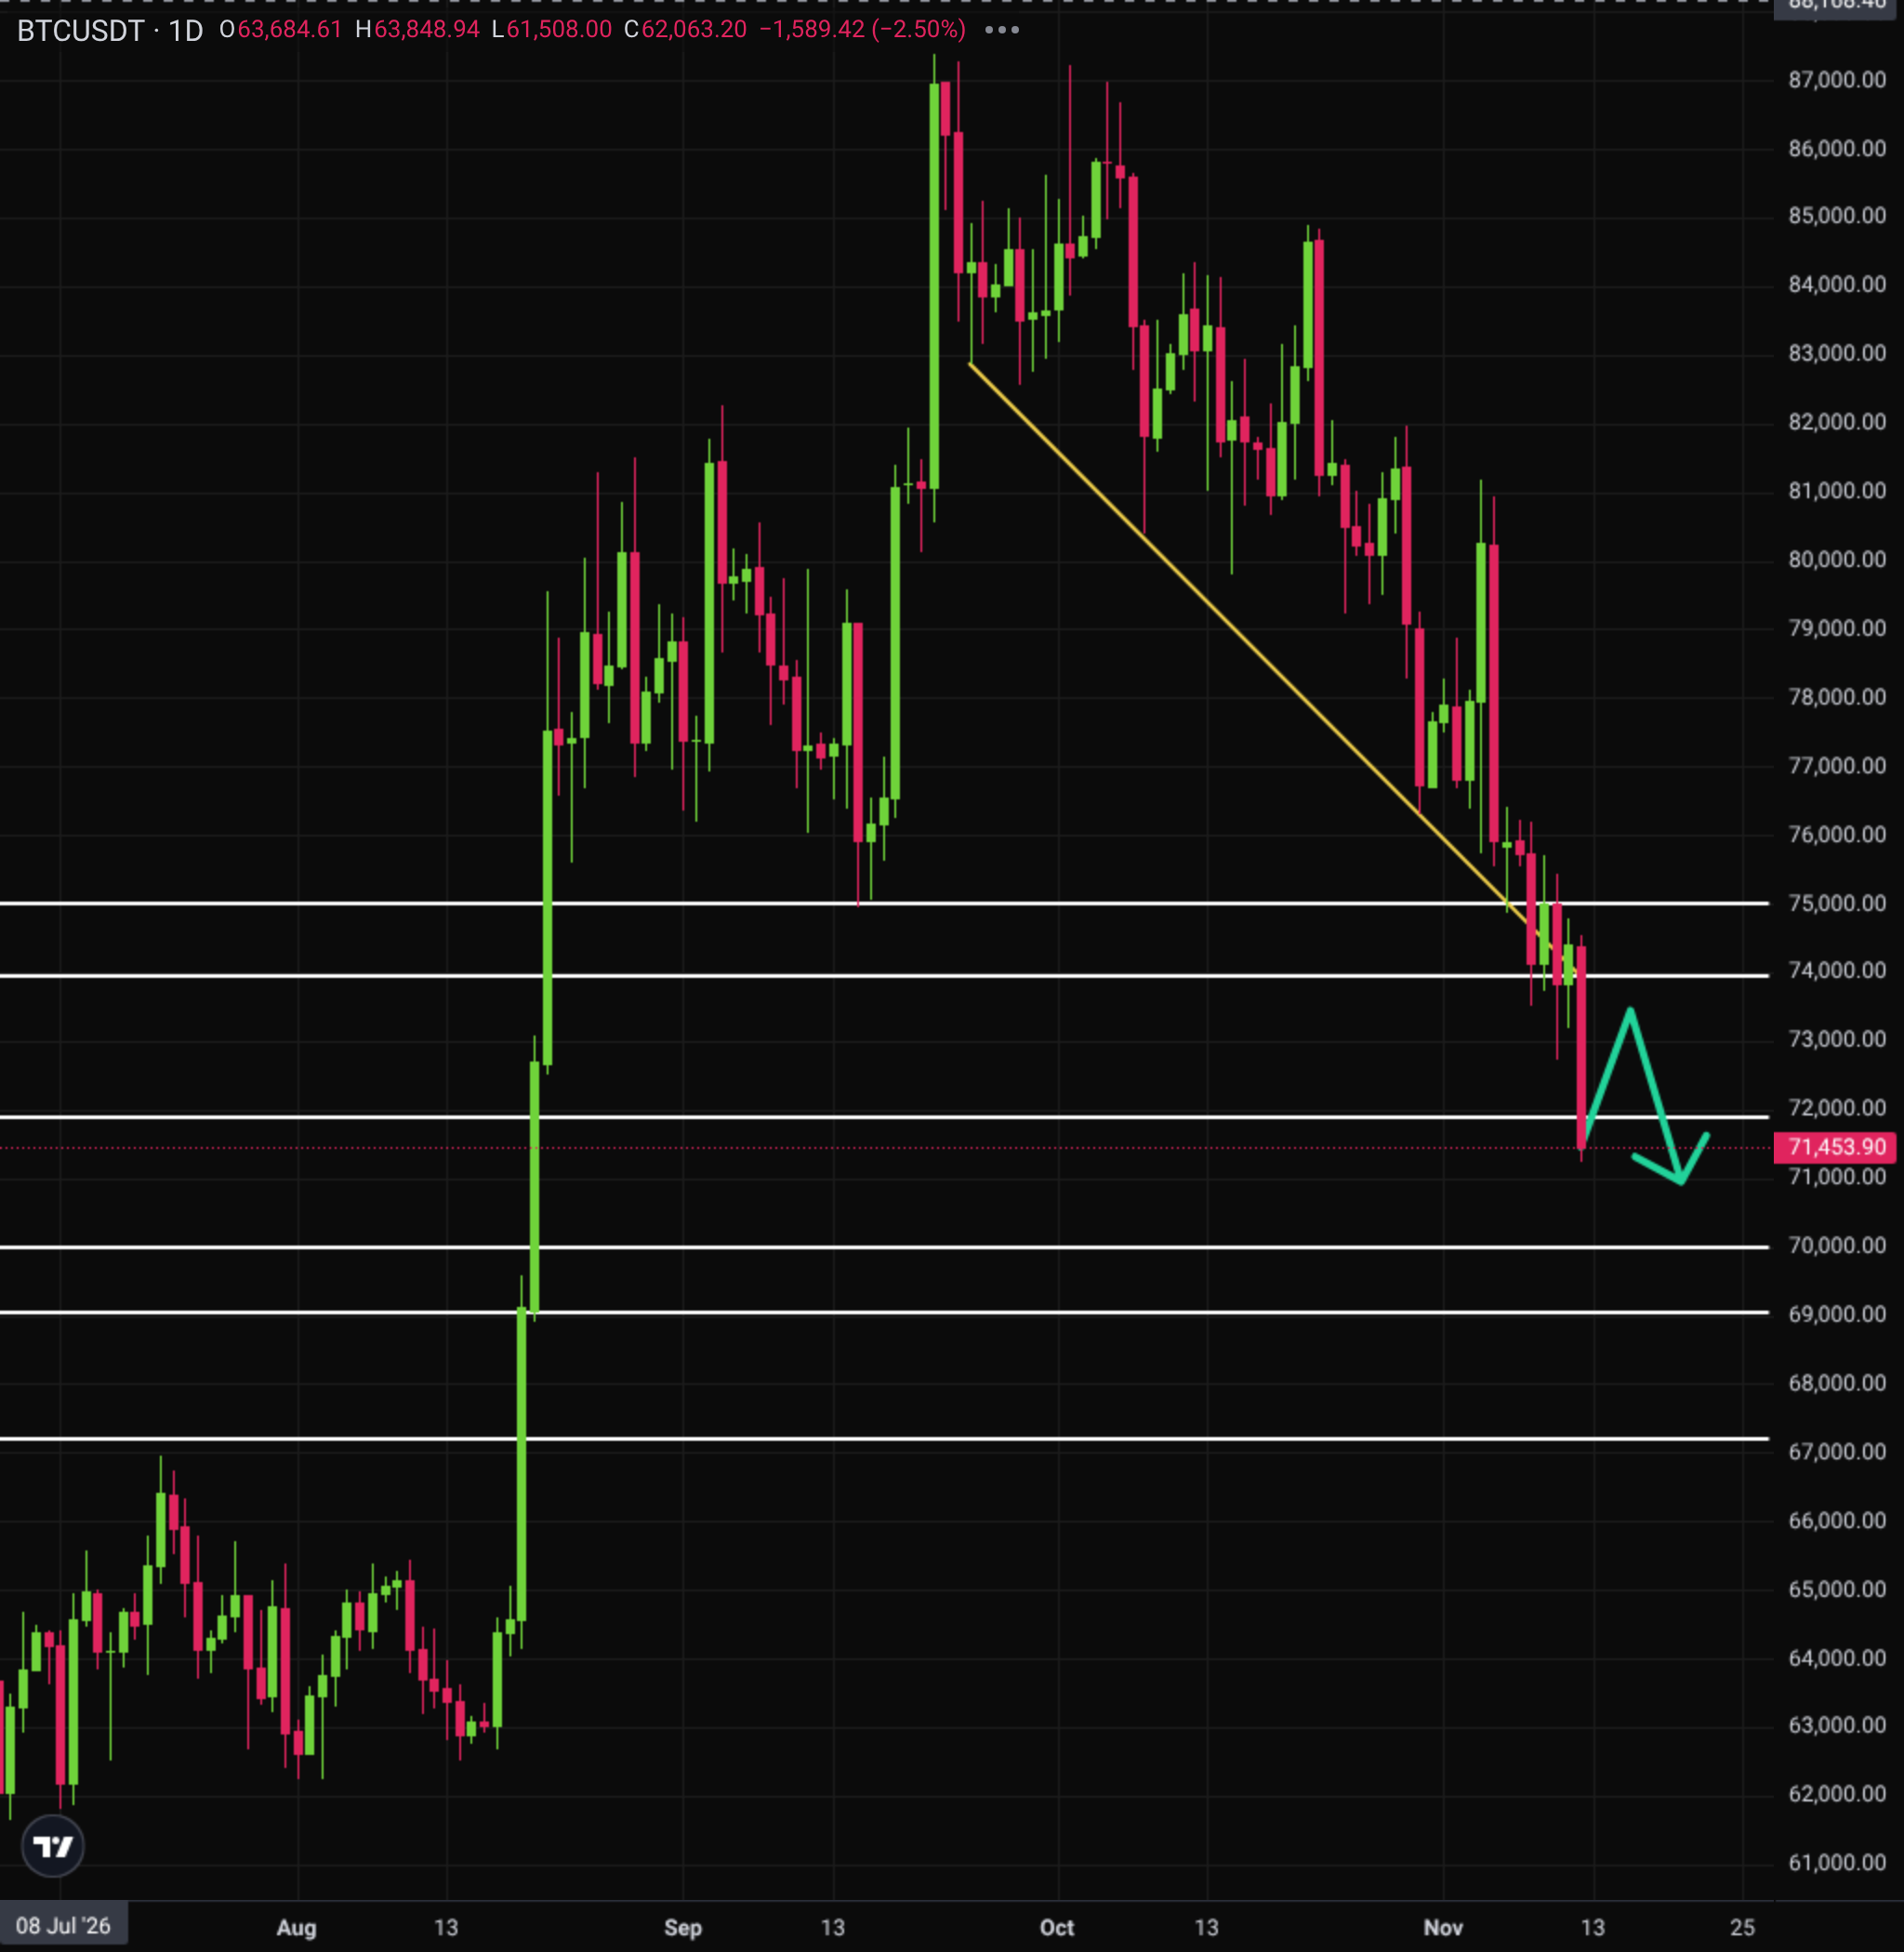
The daily candle is bearish: RSI (14) is at 30.8 and MACD is below its signal line, with EMA20 at $76,820 and EMA50 at $78,588 still far overhead. Nearest D1 support is $70,000 and the first resistance is $71,888; the falling support trendline is already broken.
Latest Bitcoin (BTC/USD) Technical Analysis for Today
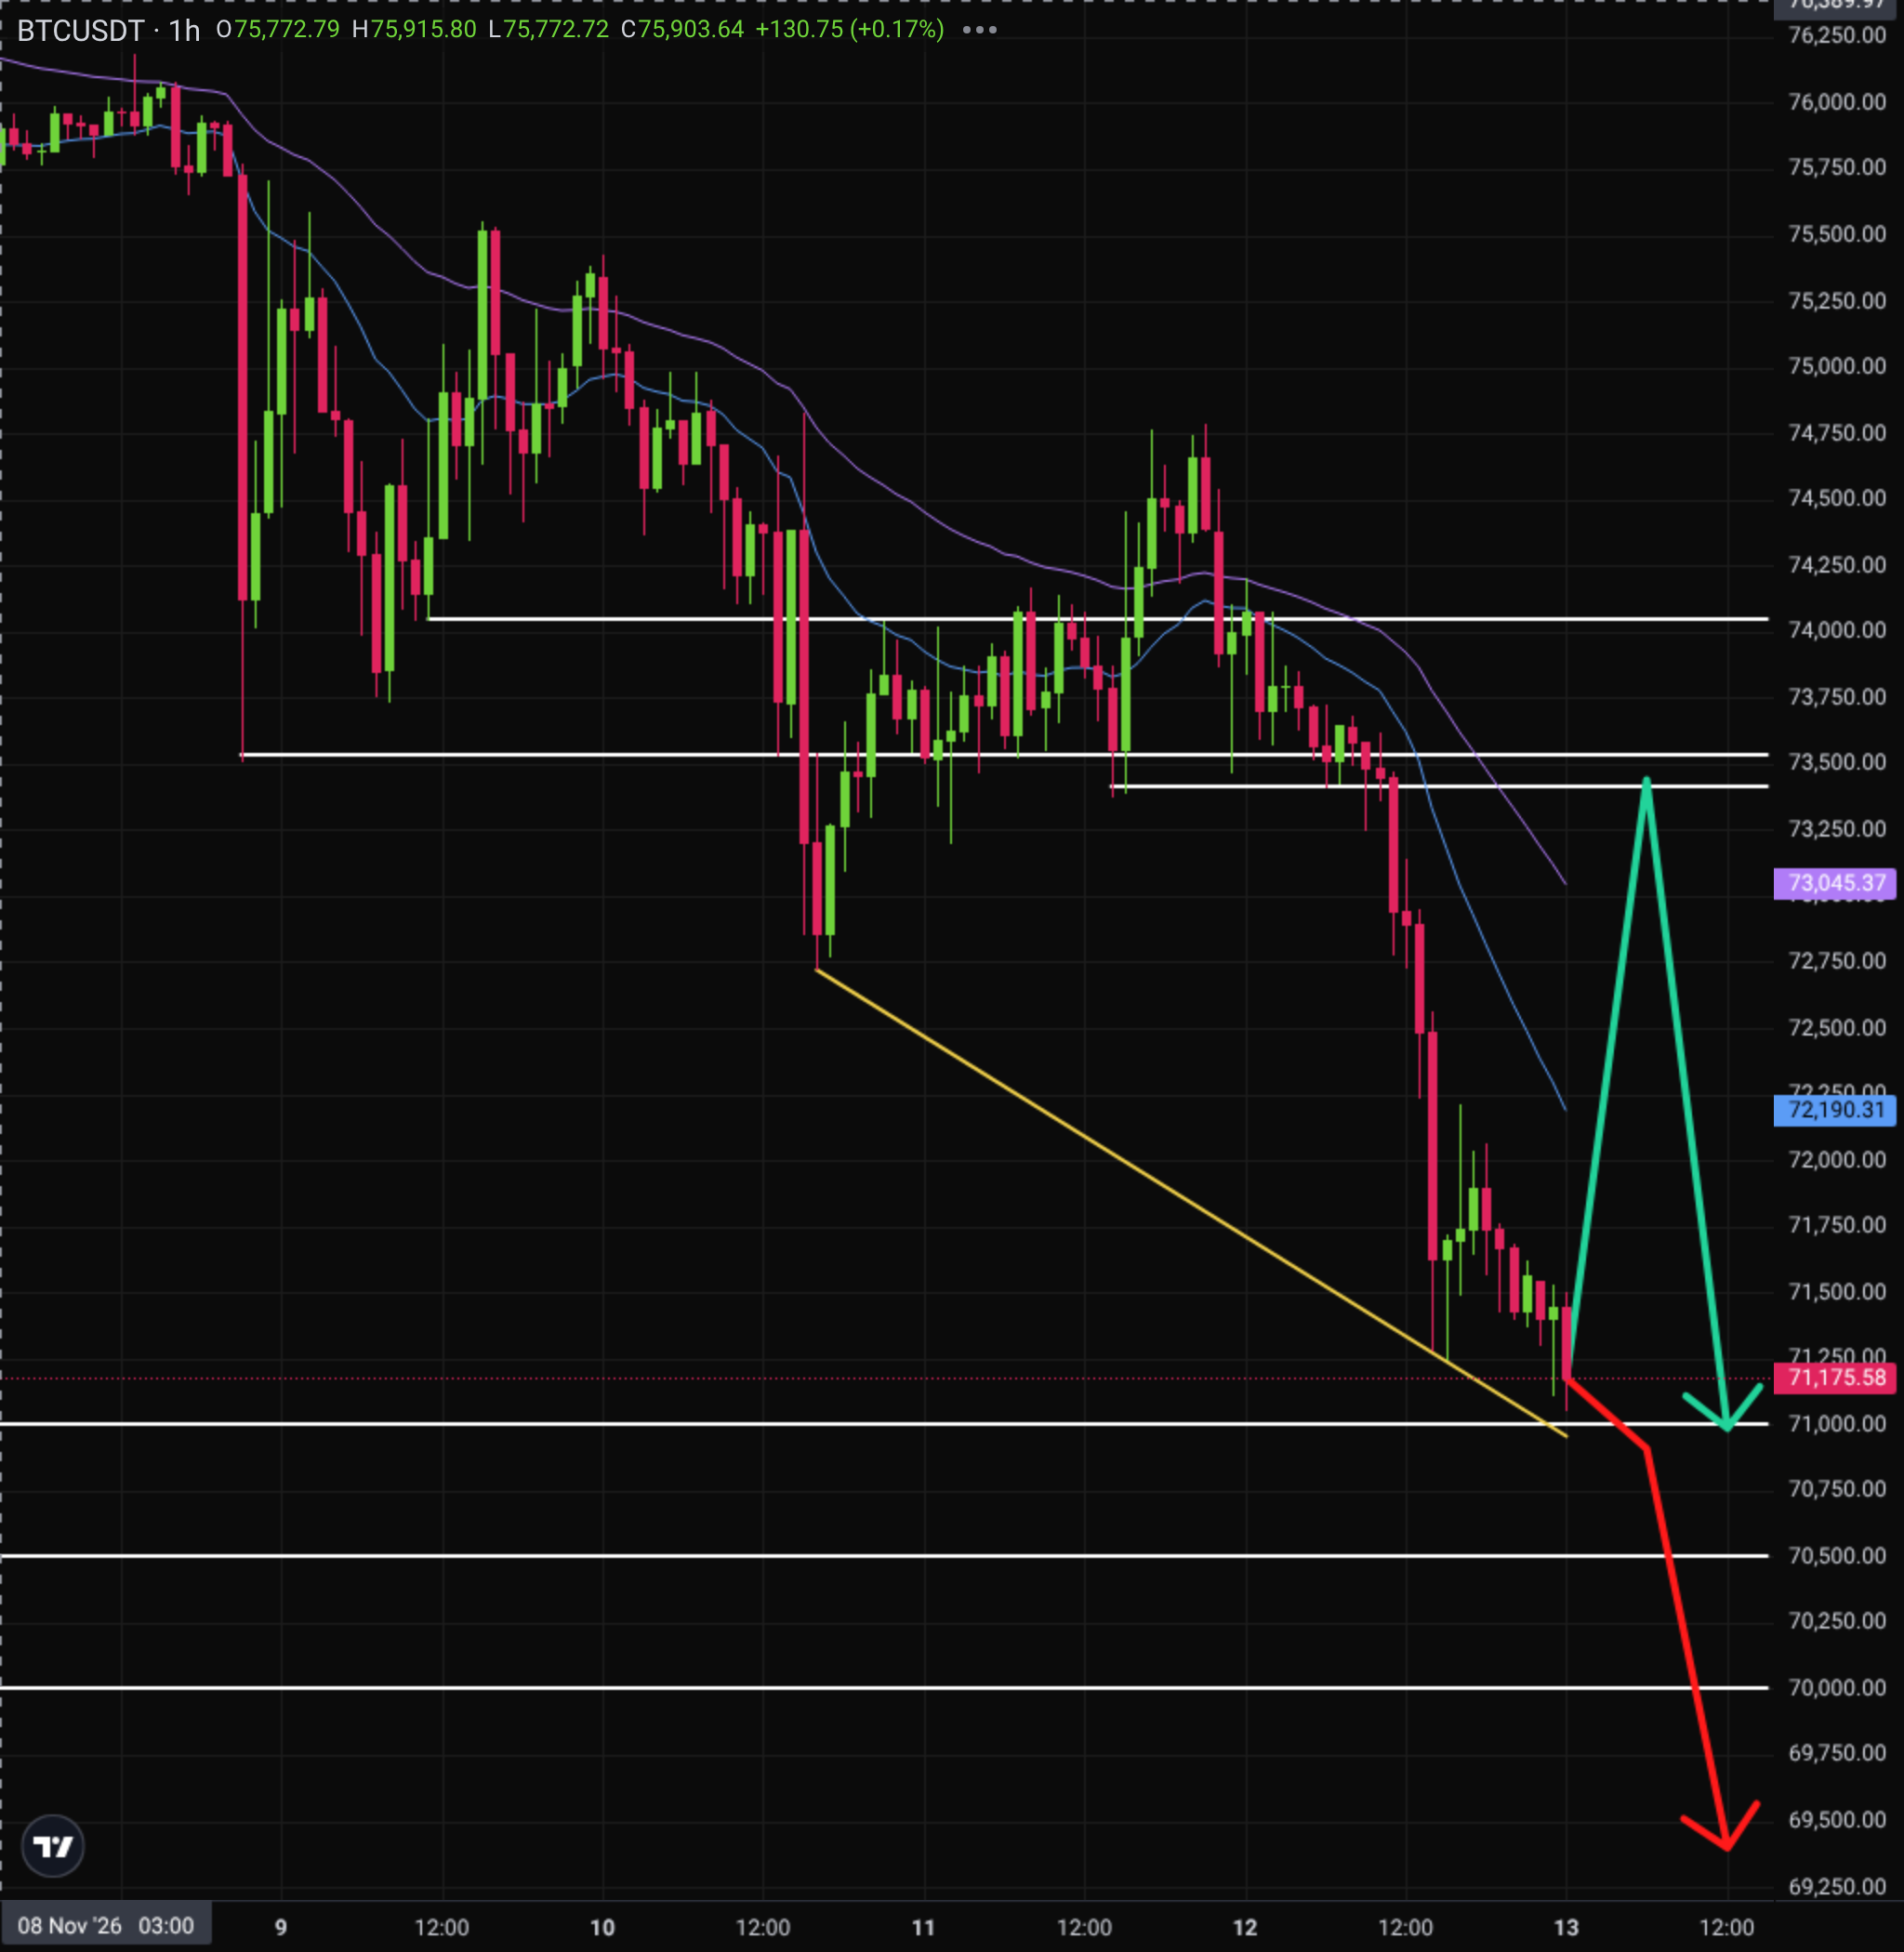
As of 13 Nov 2026, 00:00 UTC, Bitcoin trades at $71,175.58 and the H1 chart stays bearish while price holds below EMA20 at $72,190. Sellers pressed the session low near $71,048, with support at $71,000 and the descending trendline near $70,956 still holding. RSI (14) at 23.3 is deep in oversold territory (MACD is below its signal line), so a corrective bounce cannot be ruled out toward resistance at $73,414.
RSI (14): 23.3 · MACD: below signal · EMA20: $72,190 · EMA50: $73,045 · ATR (14): $441
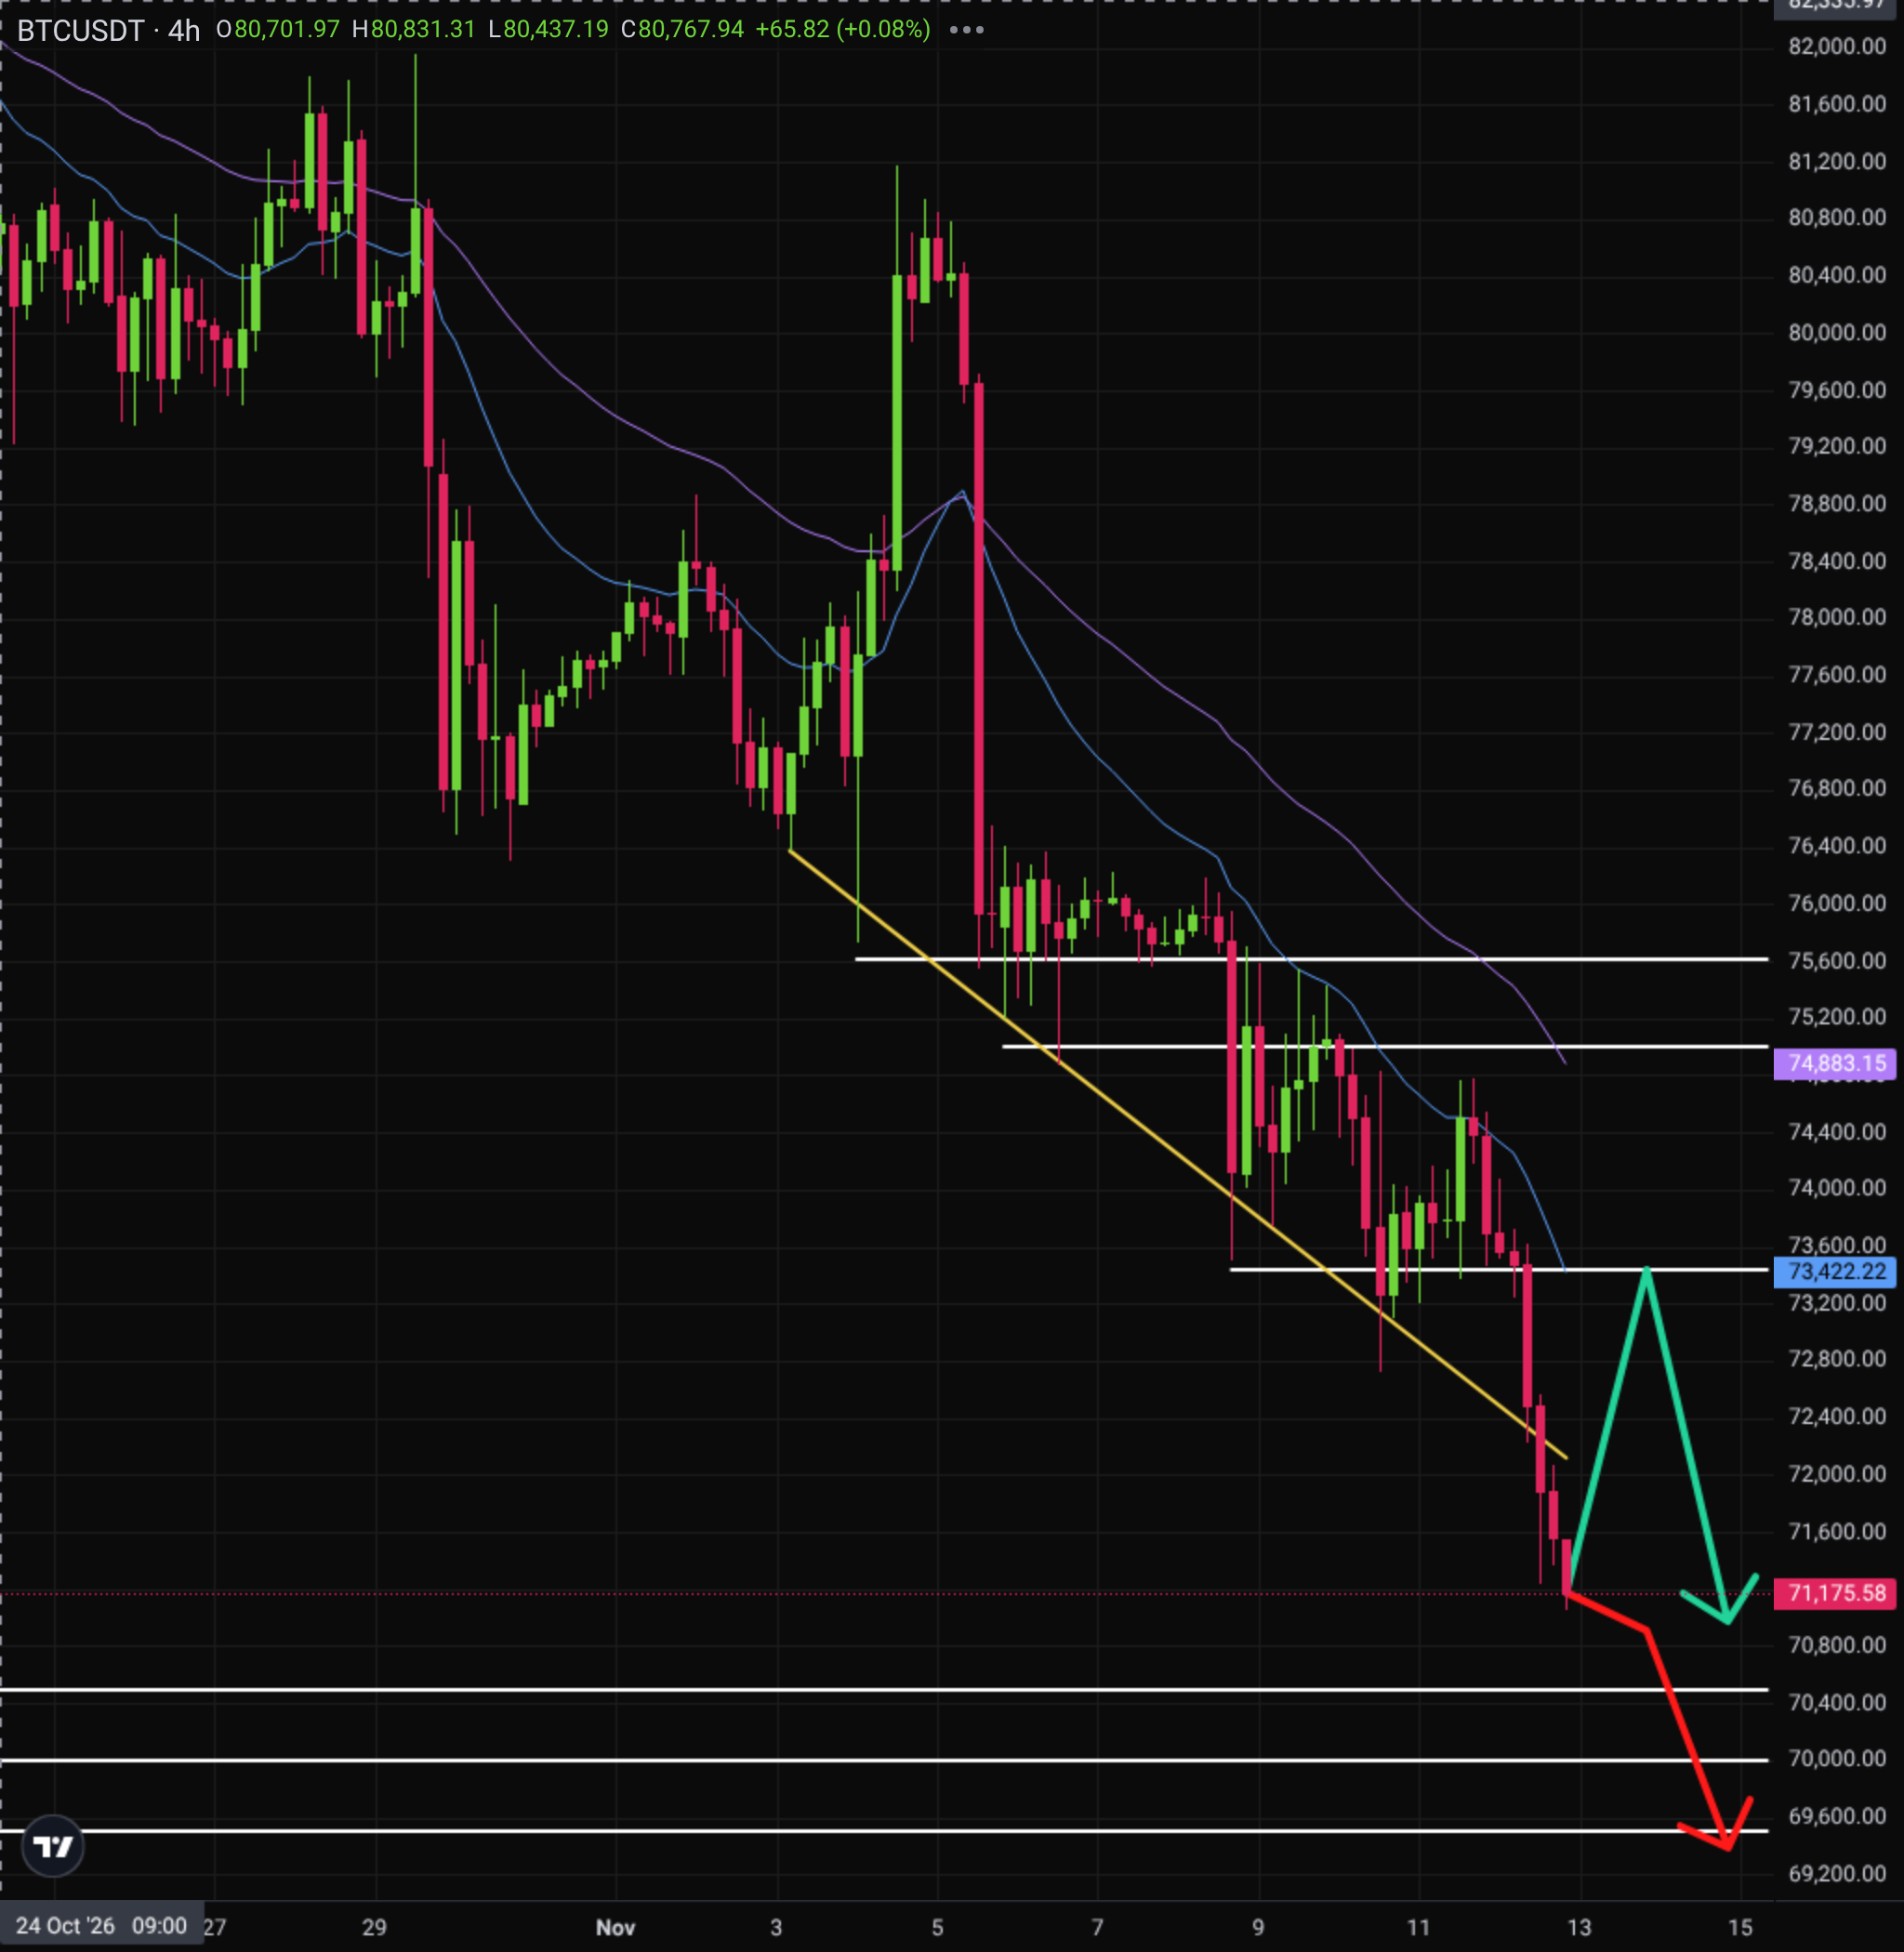
Bitcoin's H4 chart keeps a bearish technical outlook as of 13 Nov, 00:00 UTC, with price at $71,176 below EMA20 at $73,422 and EMA50 at $74,883. The falling support trendline near $72,120 gave way, and the path of least resistance points toward $70,500 while price holds below resistance at $73,439. RSI (14) at 24.0 is deep in oversold territory and MACD is below its signal line, so a corrective bounce cannot be ruled out.
RSI (14): 24.0 · MACD: below signal · EMA20: $73,422 · EMA50: $74,883 · ATR (14): $881
Key Bitcoin Support and Resistance Levels
Bitcoin (BTC/USD) Trading Plan for Today
Base case (1–3 days): sell a rebound into $73,439, target $71,000; a move above $74,346 invalidates it. Alternative: a sell stop on a break below $70,909 targets $69,412, with invalidation back above $71,907. The path of least resistance points lower while price holds beneath the rebound entry. Our latest BTCUSD technical analysis keeps the near-term lean bearish unless that rebound fails to draw sellers.
Bitcoin (BTC/USD) Price Forecast for Tomorrow
Our base case for the Bitcoin price tomorrow is a further decline, and we expect Bitcoin to reach $71,000 on 13 Nov. That sits inside our volatility range of $68,702–73,912 (−3.9%, +3.4%), which covers 80% of similar past moves and is not a price target. PPI MoM on 13 Nov (BLS), forecast at 0.4% after 1.3%, is the risk that could keep the move two-directional.
Measured from $71,454, the price at 20:00 UTC on 12 Nov 2026. In the past, moves over the same span stayed inside both bounds 80% of the time.
Bitcoin (BTC/USD) Price Forecast for This Week
Our base case for the Bitcoin price this week is still lower, and we expect Bitcoin to reach $71,000 by 15 Nov. Lookonchain reported spot ETF outflows of 3,621 BTC, worth $262.8 million, on 12 Nov, which fits weaker institutional demand. PPI on 13 Nov (BLS) is the one data point inside this window. Our volatility range is $66,996–75,500 (−6.2%, +5.7%), and it is not a price target.
Measured from $71,454, the price at 20:00 UTC on 12 Nov 2026. In the past, moves over the same span stayed inside both bounds 80% of the time.
Upcoming Economic Events
Key USD events from the Investizo economic calendar; it lists events through 25 Nov 2026 so far.
Bitcoin (BTC/USD) Price Forecast for the Next 30 Days
Our base case for the next 30 days points to $73,500, with selling pressure the path of least resistance while BTC/USD holds below $75,227. As of 9 Nov 2026, 20:00 UTC, Bitcoin trades at $74,732.43, and the weekly trend stays bearish beneath EMA20 at $76,308. Spot ETF flows remain a driver: Glassnode said on X that Bitcoin trades near $75k after ETF outflows hit their heaviest level since early July. US inflation data on 10 Nov (BLS) is the first test, with PPI on 13 Nov (BLS), retail sales on 17 Nov (U.S. Census Bureau) and FOMC minutes on 18 Nov (Federal Reserve) still ahead. A hotter CPI print could keep real-yield and dollar pressure on crypto, given Bitcoin's correlation with the stock market. Our 30-day volatility range runs from $55,413 to $87,940 (−25.9% to +17.7%), an estimate that held 80% of comparable past moves, not a price target. A move through $80,000 would point toward $82,548 instead; a break of $70,000 cannot be ruled out if risk appetite fades.
Measured from $74,732, the price at 20:00 UTC on 9 Nov 2026. In the past, moves over the same span stayed inside both bounds 80% of the time.
Volatility-based estimate, not a price target: 90th percentile of historical moves over the same number of days in the last 17 months of daily data, in ATR (14, D1) units, scaled by the current ATR. The range is measured from the price at the time of the forecast; its shape reflects past moves, not our view.
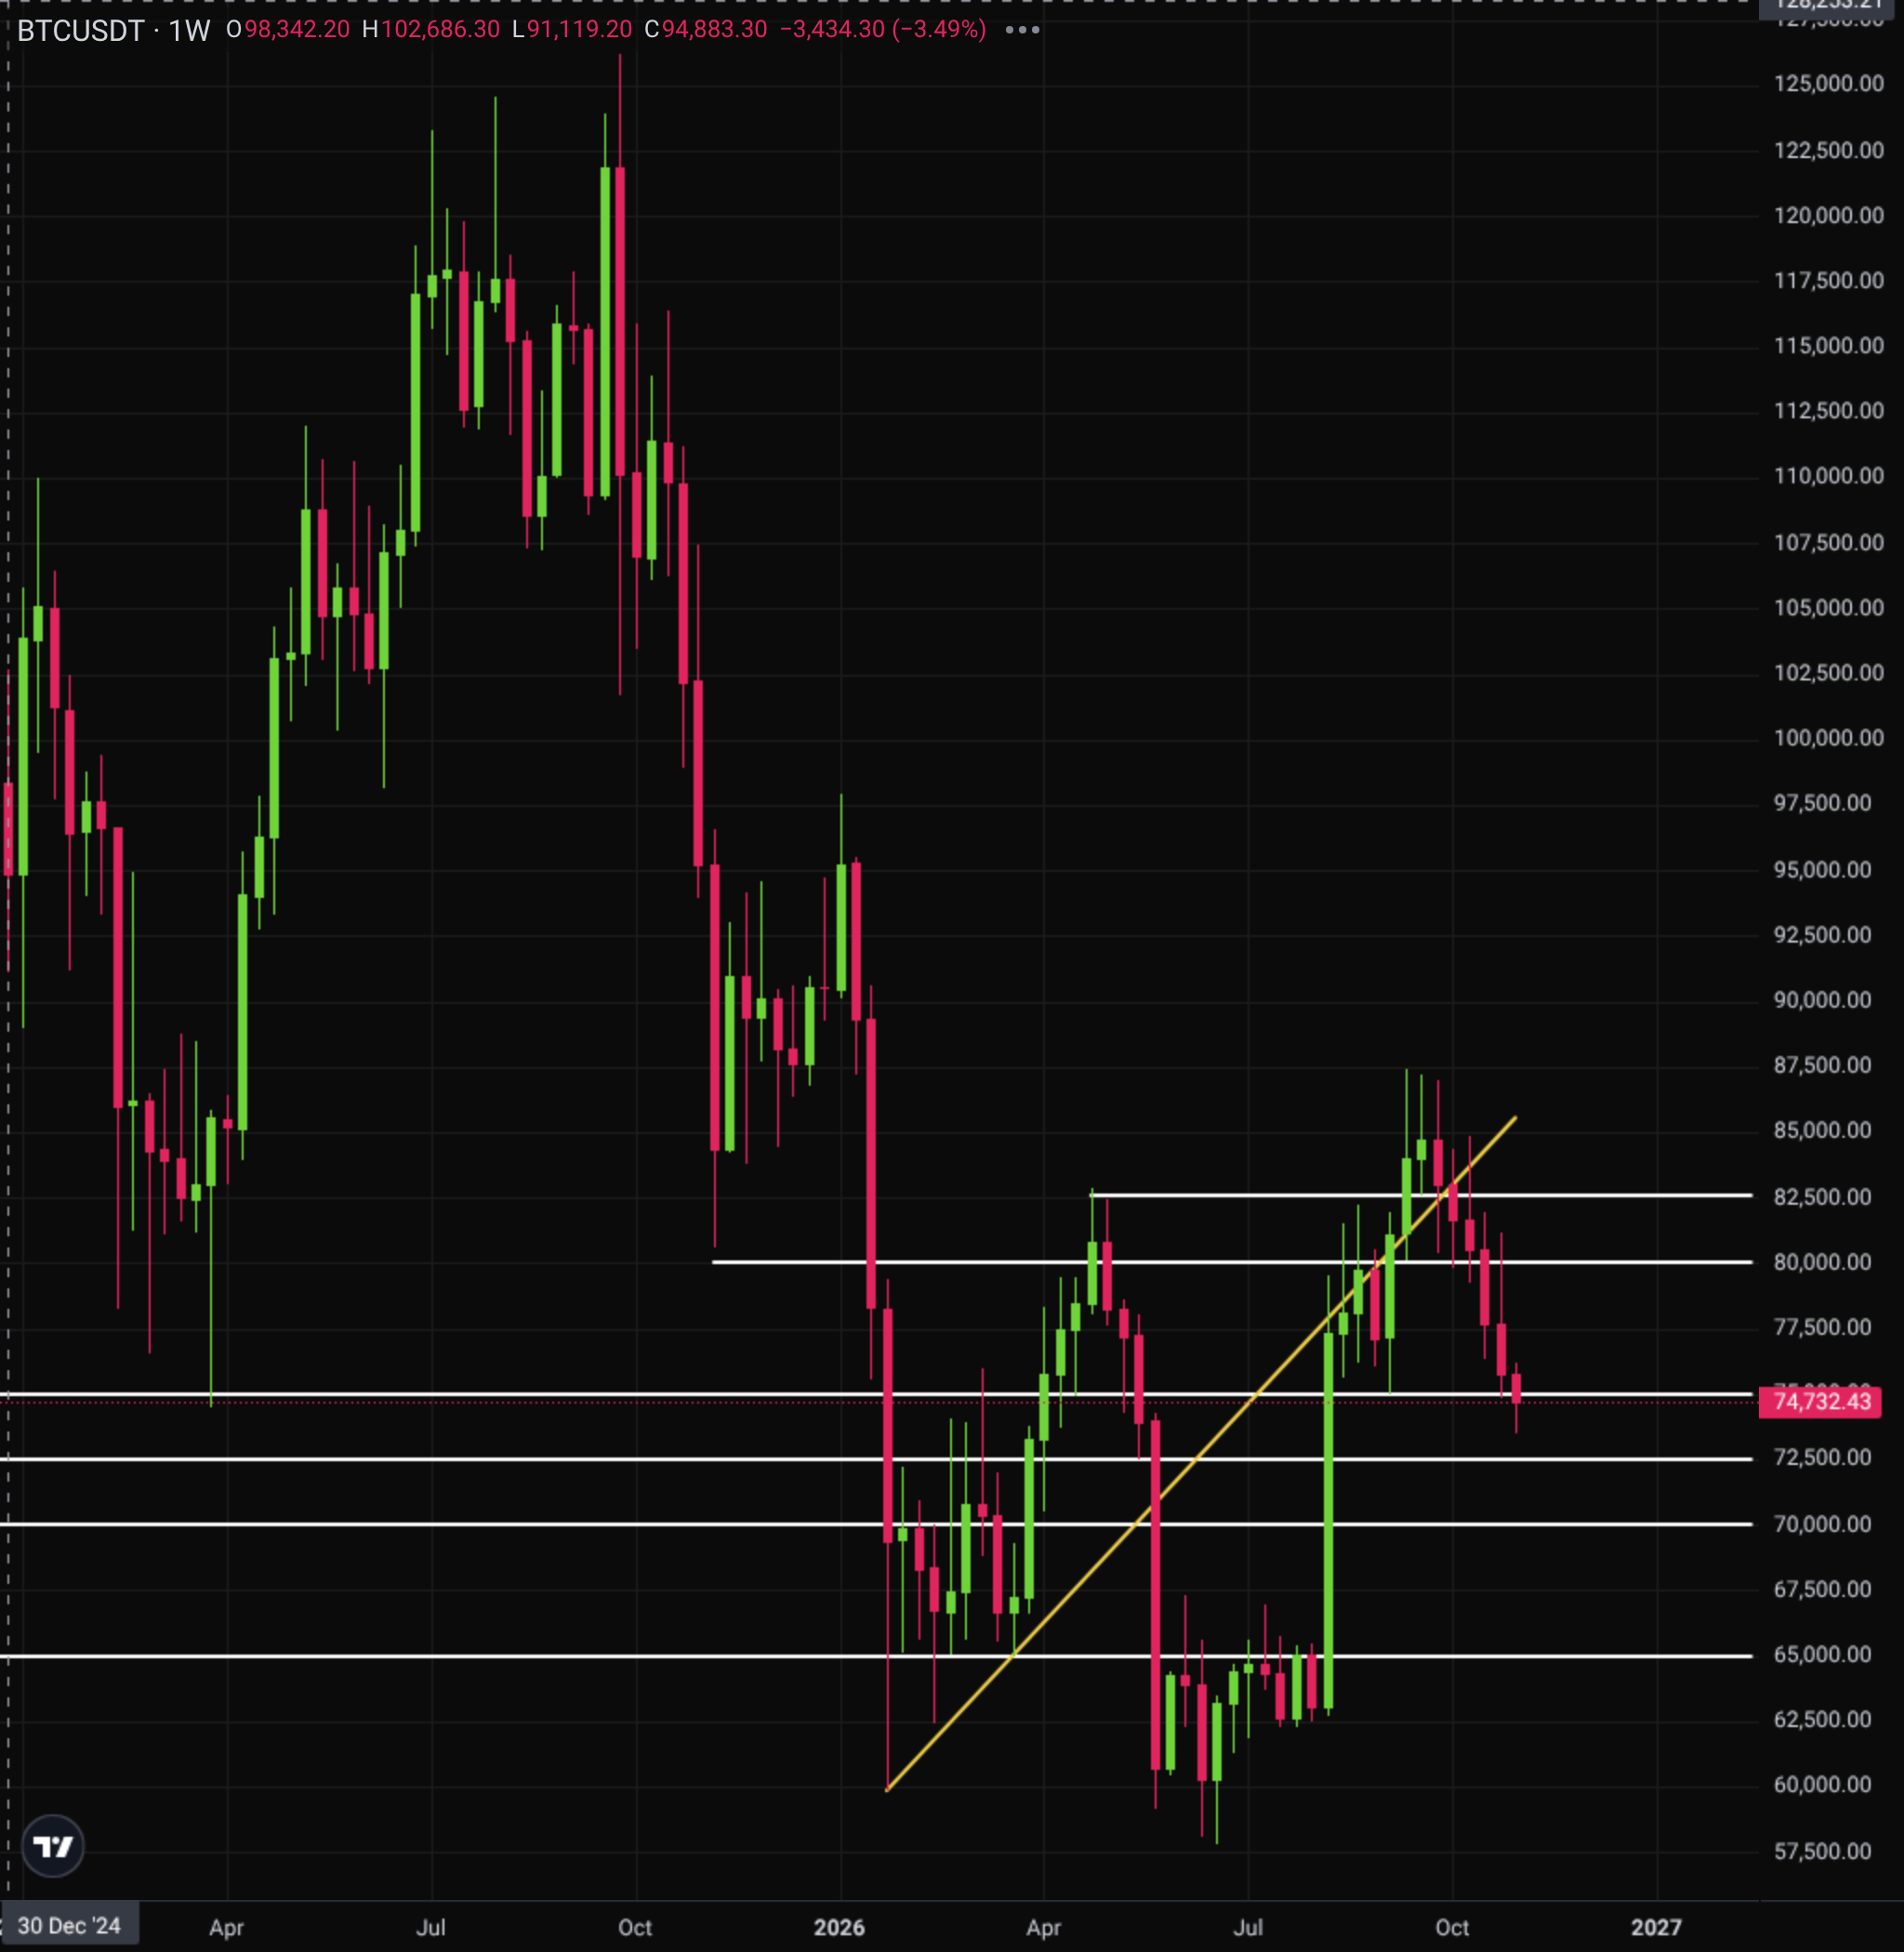
On the weekly chart Bitcoin remains bearish, with price at $74,732.43 under EMA20 at $76,308 and EMA50 at $78,096. RSI (14) at 47.8 is mid-range while MACD is above its signal line, and the rising support trendline has already broken; nearest support sits at $72,492, with $75,000 the first overhead resistance.
30-Day Scenarios
- Base case: BTC/USD drifts toward $73,500 over the next 30 days if rebounds stall under $75,000.
- Bullish: a breakout above $80,000 would target $82,548, still inside our 30-day volatility range.
- Bearish: a breakdown below $70,000 opens $65,000 if risk sentiment and ETF flows stay heavy.
Is Bitcoin a Good Investment?
Institutional demand, spot ETF flows and regulatory news are the drivers that decide whether Bitcoin is a good investment in 2026, alongside its correlation with the stock market. ETF creations and redemptions can change demand within a day, so you take flow shocks as well as price risk. A regulatory headline can reprice BTC/USD before the chart digests it, and an equity selloff can pull Bitcoin with it. Those drivers explain why traders follow the market; they do not remove the risk of a deep drawdown while the broader bias stays bearish.
You can open an account with Investizo: Register at Investizo.
Summary
Bitcoin stays bearish as of 12 Nov, 20:00 UTC, with the price at $71,453.9. Only a move above $74,346 would flip that bias. PPI on 13 Nov (BLS) is the catalyst that could test the view before the week ends on 15 Nov.
Bitcoin Price Analysis and Forecasting Methodology
Our Bitcoin forecast methodology combines technical analysis, fundamentals and news sentiment. Prices are Investizo MT4 quotes. Indicators: EMA20 and EMA50, RSI (14), MACD (12, 26, 9) and ATR (14), on H1, H4, D1 and weekly bars. Support and resistance come from swing highs and lows (clustered within a quarter of ATR) and round psychological numbers; trendlines connect swing points. The bias follows the H4 and daily trends (price and EMA20 against EMA50). Entries sit at a level, on a retest or on a break of a level; the stop is the level that invalidates the setup, and the target is the next level with at least 1.5 times the risk. Ranges for the next day, week and 30 days are volatility-based, as described under the 30-day table. Fundamentals come from the Investizo economic calendar and primary releases of central banks and statistics agencies. An hourly digest of news sites and selected X accounts adds news sentiment: it explains moves and risks but never sets levels.
Sources
- Federal Reserve, 10 Nov 2026: The 10-year Treasury constant maturity yield was 4.88 percent on November 9, 2026.
- Economic data: official statistics agencies and central banks via the Investizo economic calendar.
- Prices: Investizo MT4 quotes.
The trade levels, signals and forecasts in this article are calculated automatically from technical indicators and price history. They are not investment advice or a recommendation to buy or sell any financial instrument. Past performance and forecasts do not guarantee future results. Risk Warning: CFDs are complex financial products traded on margin. Trading CFDs is risky and may not be suitable for all investors. Ensure you understand the risks involved as you may lose all your invested capital.
Bitcoin (BTC/USD) Price Forecast FAQs
What is the current price of Bitcoin (BTC/USD) now?
As of November 13, 2026, Bitcoin (BTC/USD) trades at $70,936.75. Our levels and ranges on this page are as of 12 Nov 2026, 20:00 UTC.
Will Bitcoin Go Up Tomorrow?
Our base case does not expect Bitcoin to go up tomorrow. We look for a decline toward $71,000 on 13 Nov. Our volatility range is $68,702–73,912.
Will Bitcoin Rise or Fall Next Week?
Our base case is that Bitcoin falls toward $71,000 this week, not a rise. The volatility range through 15 Nov is $66,996–75,500. ETF outflows on 12 Nov (Lookonchain) fit that lean.
What Could Trigger a Short-Term Drop in Bitcoin (BTC/USD)?
A break of the alternative entry at $70,909 would open a drop toward $69,412. A stronger PPI print on 13 Nov (BLS) could add to selling pressure. Neither path is a fact; both stay conditional.
How Do We Do Bitcoin Technical Analysis?
We read the H1, H4, daily and weekly charts with EMA20 and EMA50, RSI (14), MACD and ATR (14). Support and resistance come from swing highs and lows and round numbers, and the bias follows the H4 and daily trends.
How to Trade Bitcoin Technical Analysis?
Use the levels as reference points: wait for the entry trigger, set the stop where the setup is invalidated and size the position so a stop-out stays within your risk limit. Our plans are analysis, not advice.
Khaled Kamal is a Market Analyst & Business Development Manager at Investizo with several years of experience in the financial services industry. His areas of focus include forex markets, trading strategies, risk management, copy trading and the practical aspects of financial markets.
Award history
More about awards
2023—2026 - 10 awards archived