XAUUSD H1: The Chaos Theory Forecast for the American Session on 12.3.2025
12.03.2025 15:46
Technical
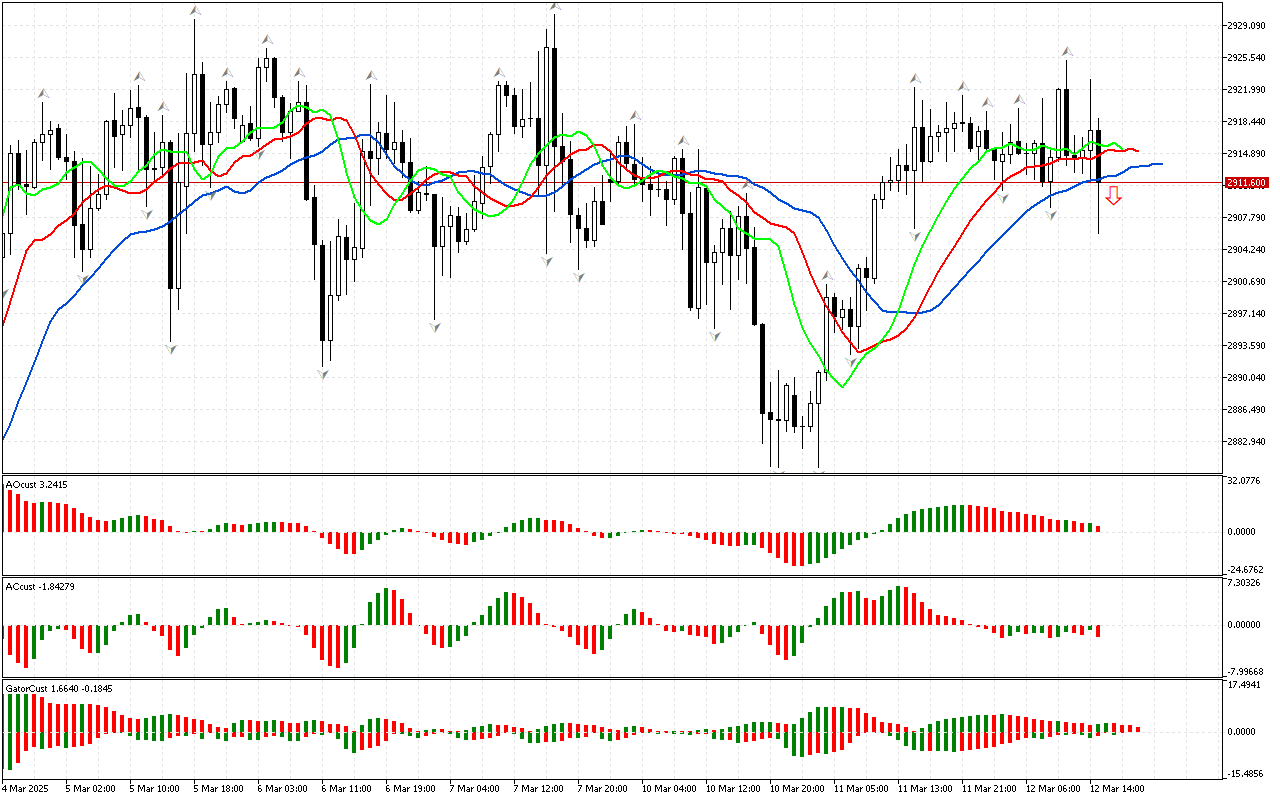
The analysis of the current market situation shows that the phase space is defined as southern. The price has fallen below the lower fractal. This may indicate the beginning of a downward movement. To gain the information about the strength and energy of this movement, let's pay attention to the positions of other indicators on the chart.
The Awesome Oscillator indicator warns of a possible change in the local direction of price movement. This is the Saucer signal. When this signal appears, you can consider opening new positions when the local maximum is updated.
As it is seen the AC and AO indicators are green. There is a sign of a correction developing or of a local trend changing. The strength and energy of the downward movement are experiencing deceleration, but the price remains below the red Alligator line. That's why a downward movement is still a priority.
The color of the histograms of the Gator indicator changes, so this indicator has not formed a clear signal yet.
To sum up, the phase space is noted to be southern, but the indicators show a signal about the possible development of a pullback movement. This possibility can be used to find entry points in the direction of the main movement at more beneficial prices.
📊 Sell Stop 2906.050
❌ Stop Loss 2913.373
After entering the market, Stop Loss is moved along the red line after closing each candle. The profit is fixed by moving Stop Loss, or when opposite signals appear on the AO, AC, Gator indicators.