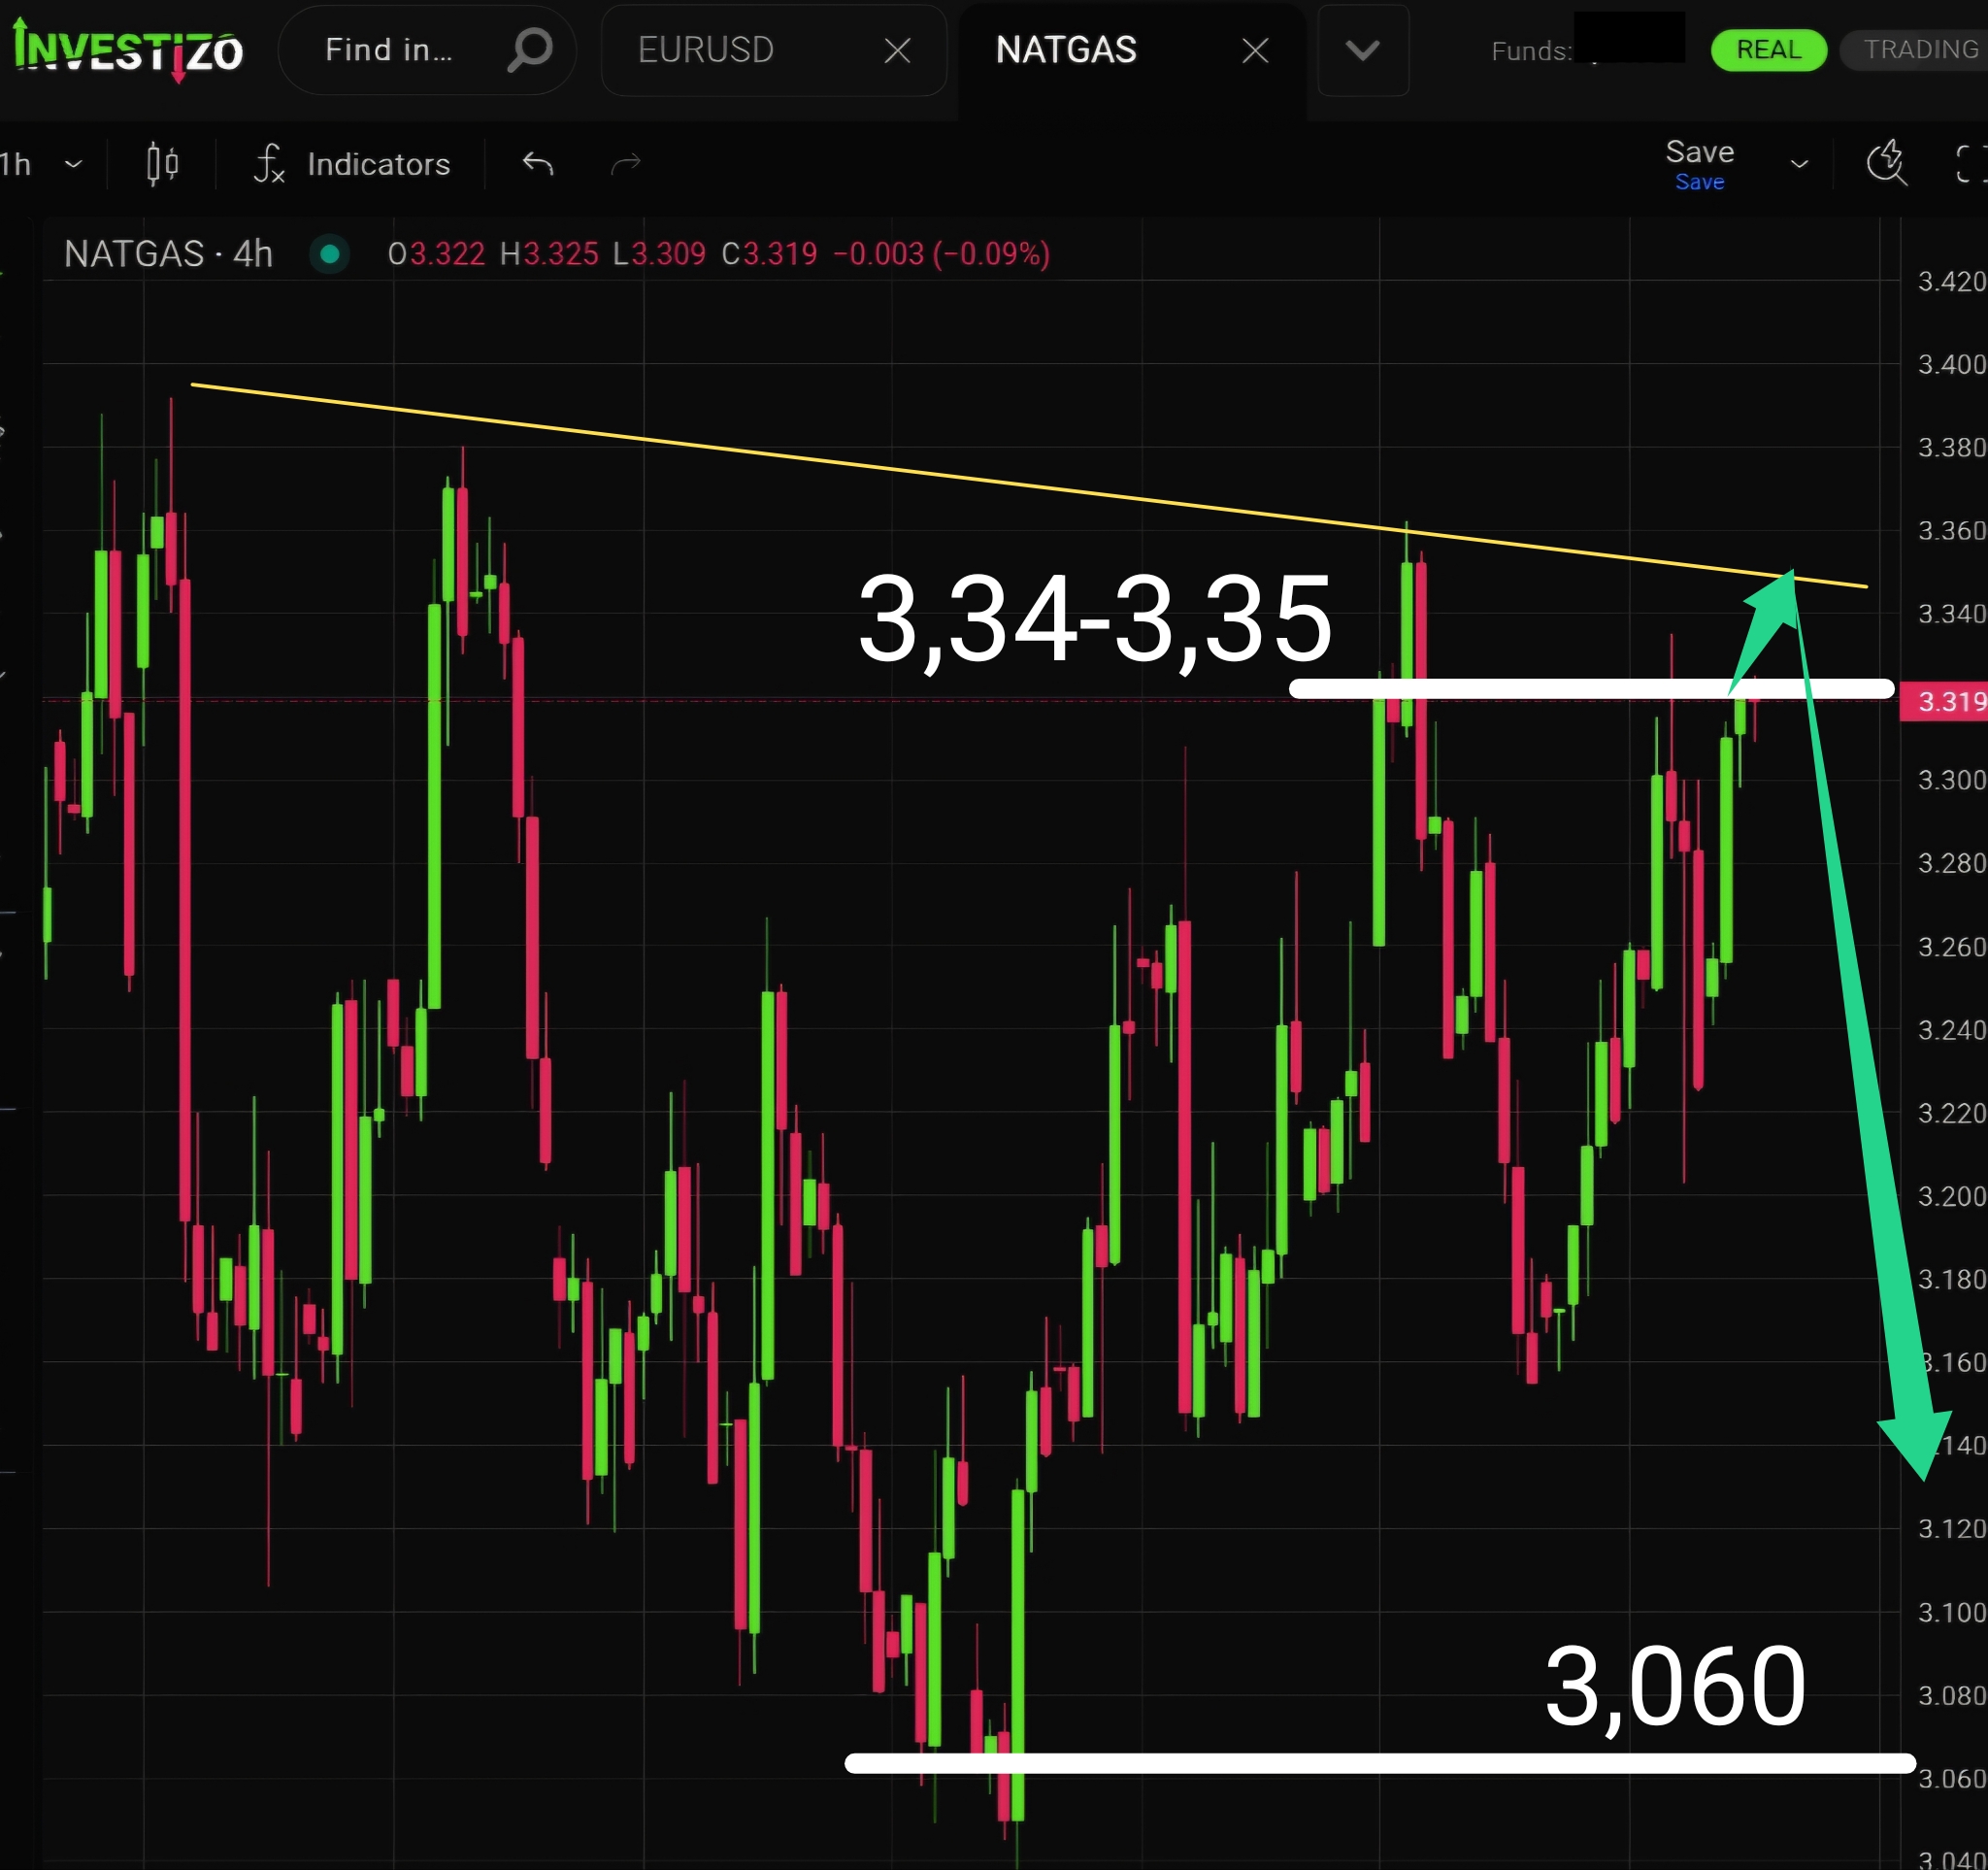
Natural Gas, Technical Analysis – H4
Natural Gas is preparing for a likely decline, with all necessary prerequisites in place. The price is approaching the key cluster at 3.34–3.35, where it has already shown signs of stalling.
Investizo LTD. Business company number 25432 BC 2019
Suite 305, Griffith Corporate Centre,
P.O. Box 1510, Beachmont, Kingstown,
St. Vincent and the Grenadines
DUNS 817053497
Phone:+996312610515
E-mail: [email protected]
© 2019-2026 Investizo 18+ 모든 권리 보유
리스크 경고: CFD는 마진으로 거래되는 복잡한 금융 상품입니다. CFD 거래는 위험하며 모든 투자자에게 적합하지 않을 수 있습니다. 투자한 모든 자금을 잃을 수 있으므로 관련 리스크를 이해하고 있는지 확인하세요
Natural Gas is preparing for a likely decline, with all necessary prerequisites in place. The price is approaching the key cluster at 3.34–3.35, where it has already shown signs of stalling.
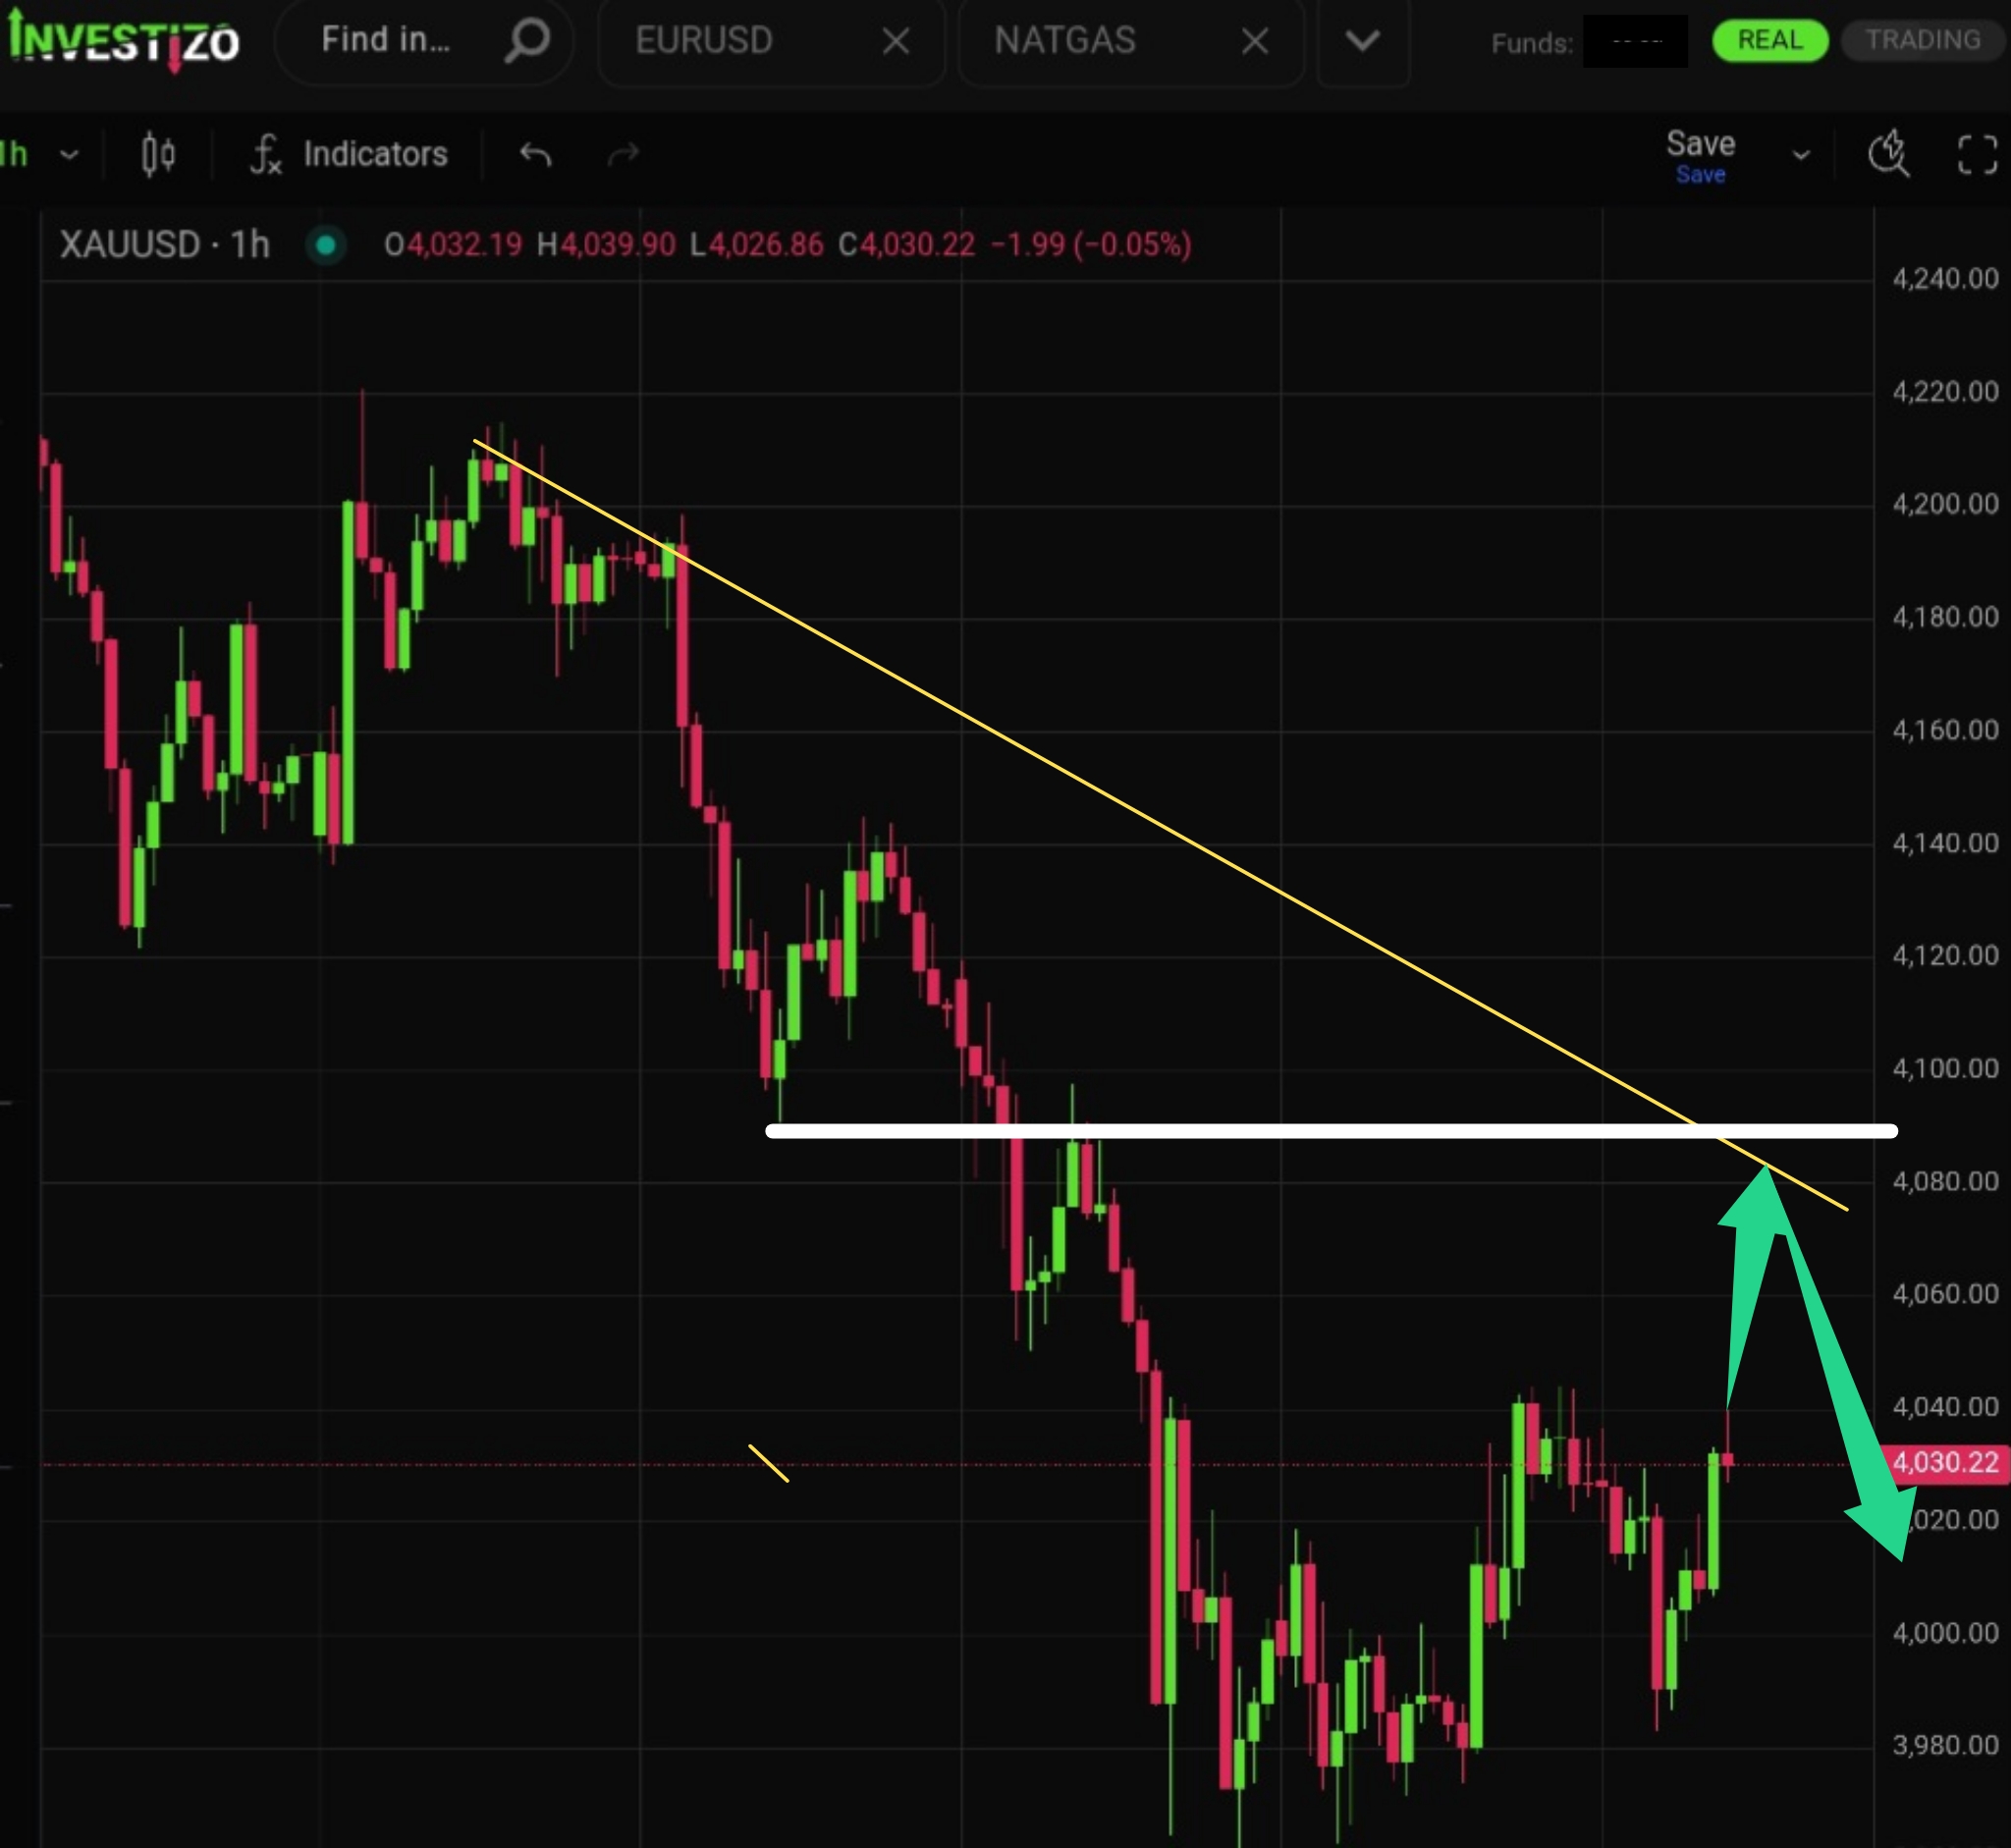
The pair has confirmed a breakdown of the uptrend by trading below the short-term trend line.
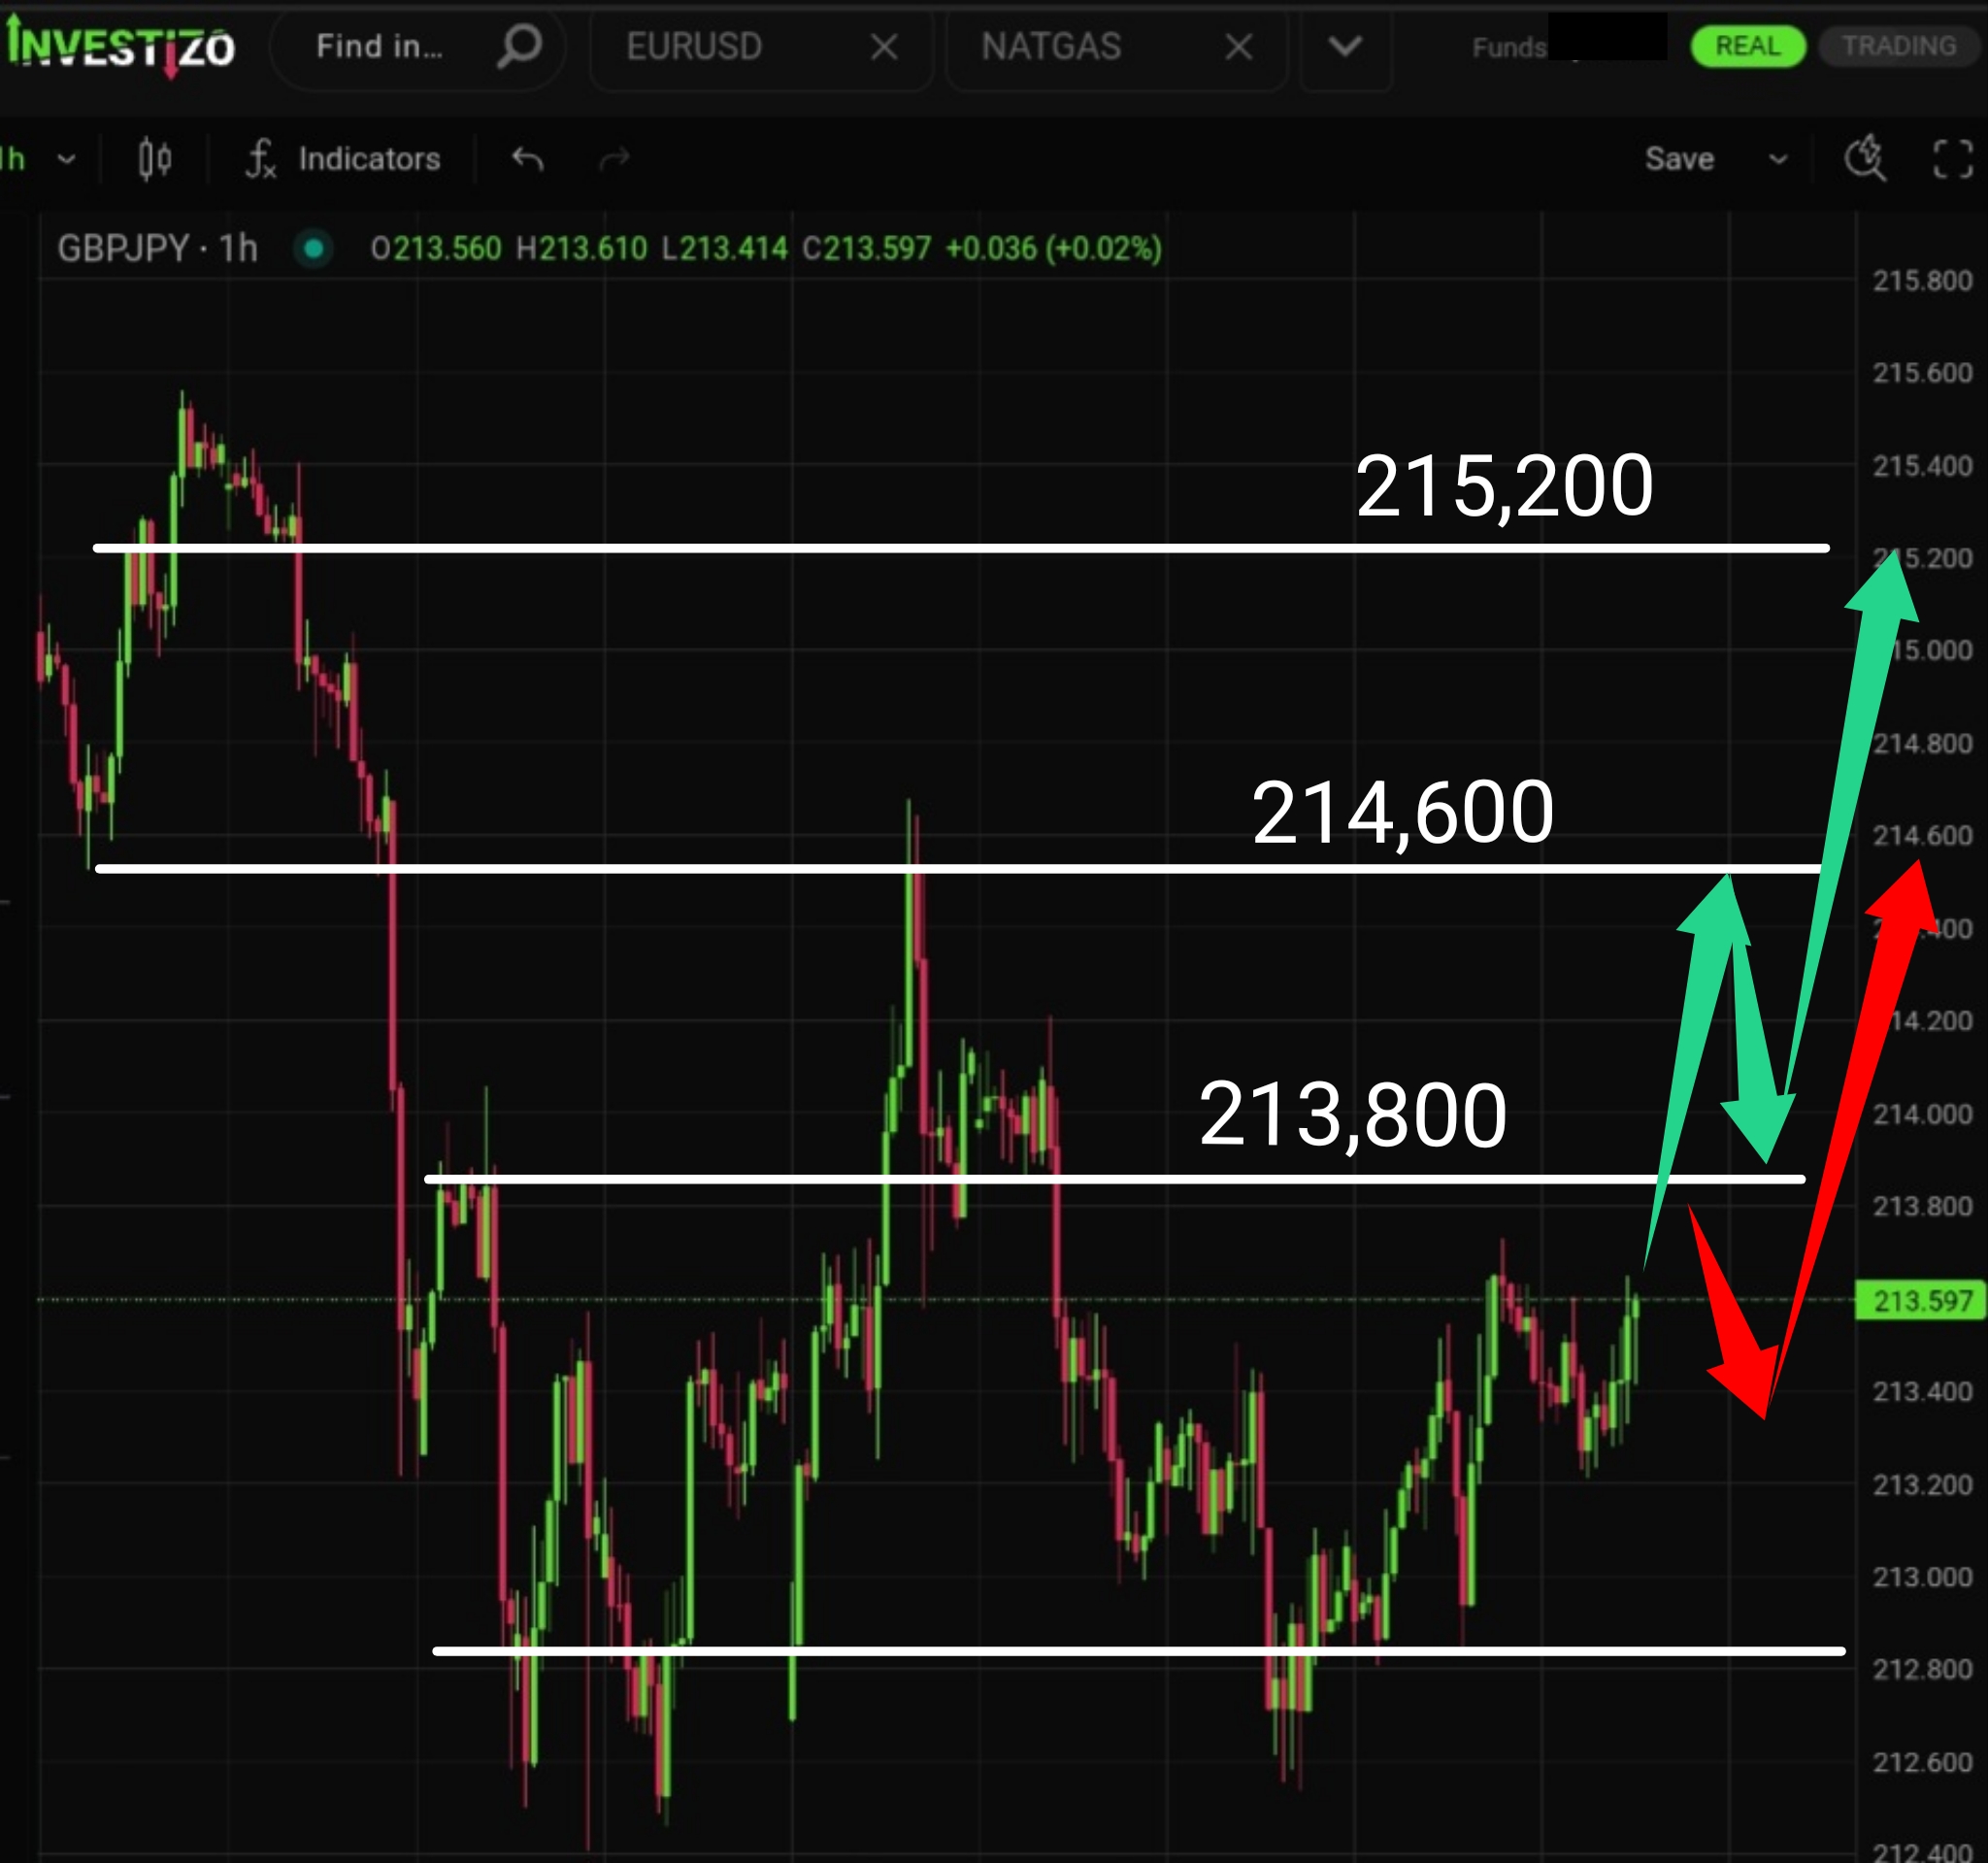
The pair is currently working off bullish sentiment gained in the demand zone of 212,800–213,000. The overall upside target is quite ambitious at 215,200.
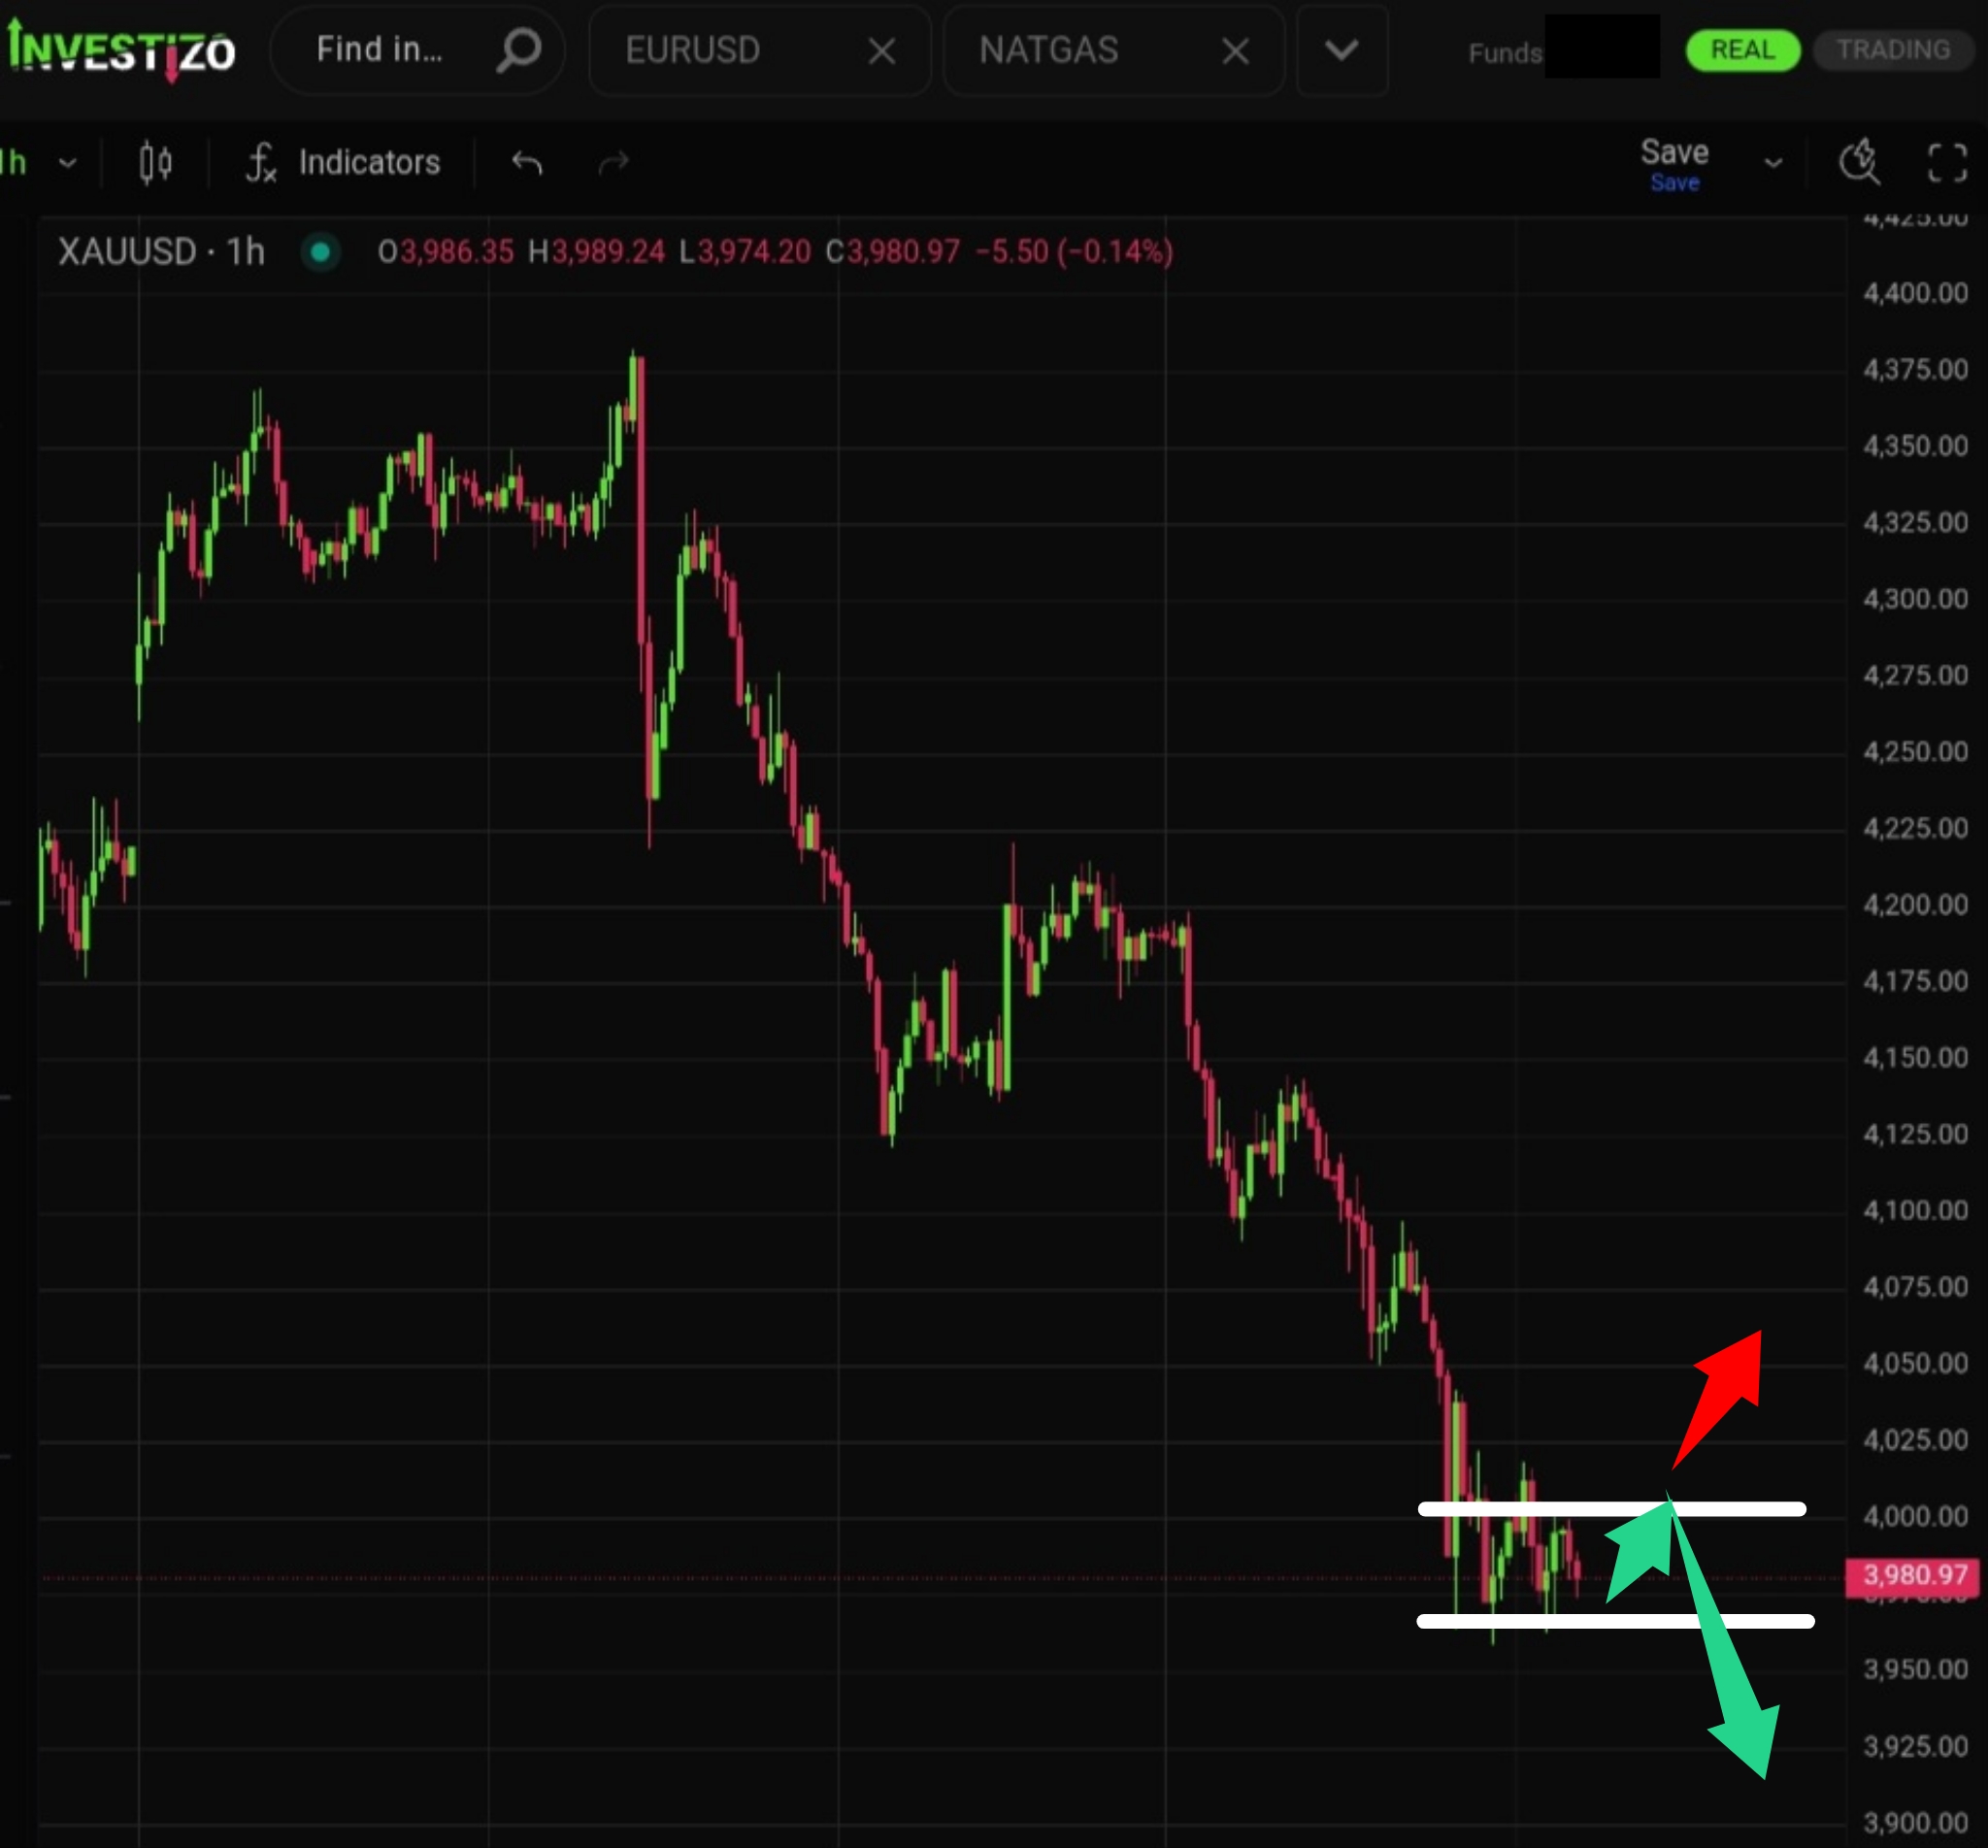
Gold is currently undergoing an upward technical correction without any clear signs of a new trend or reversal.
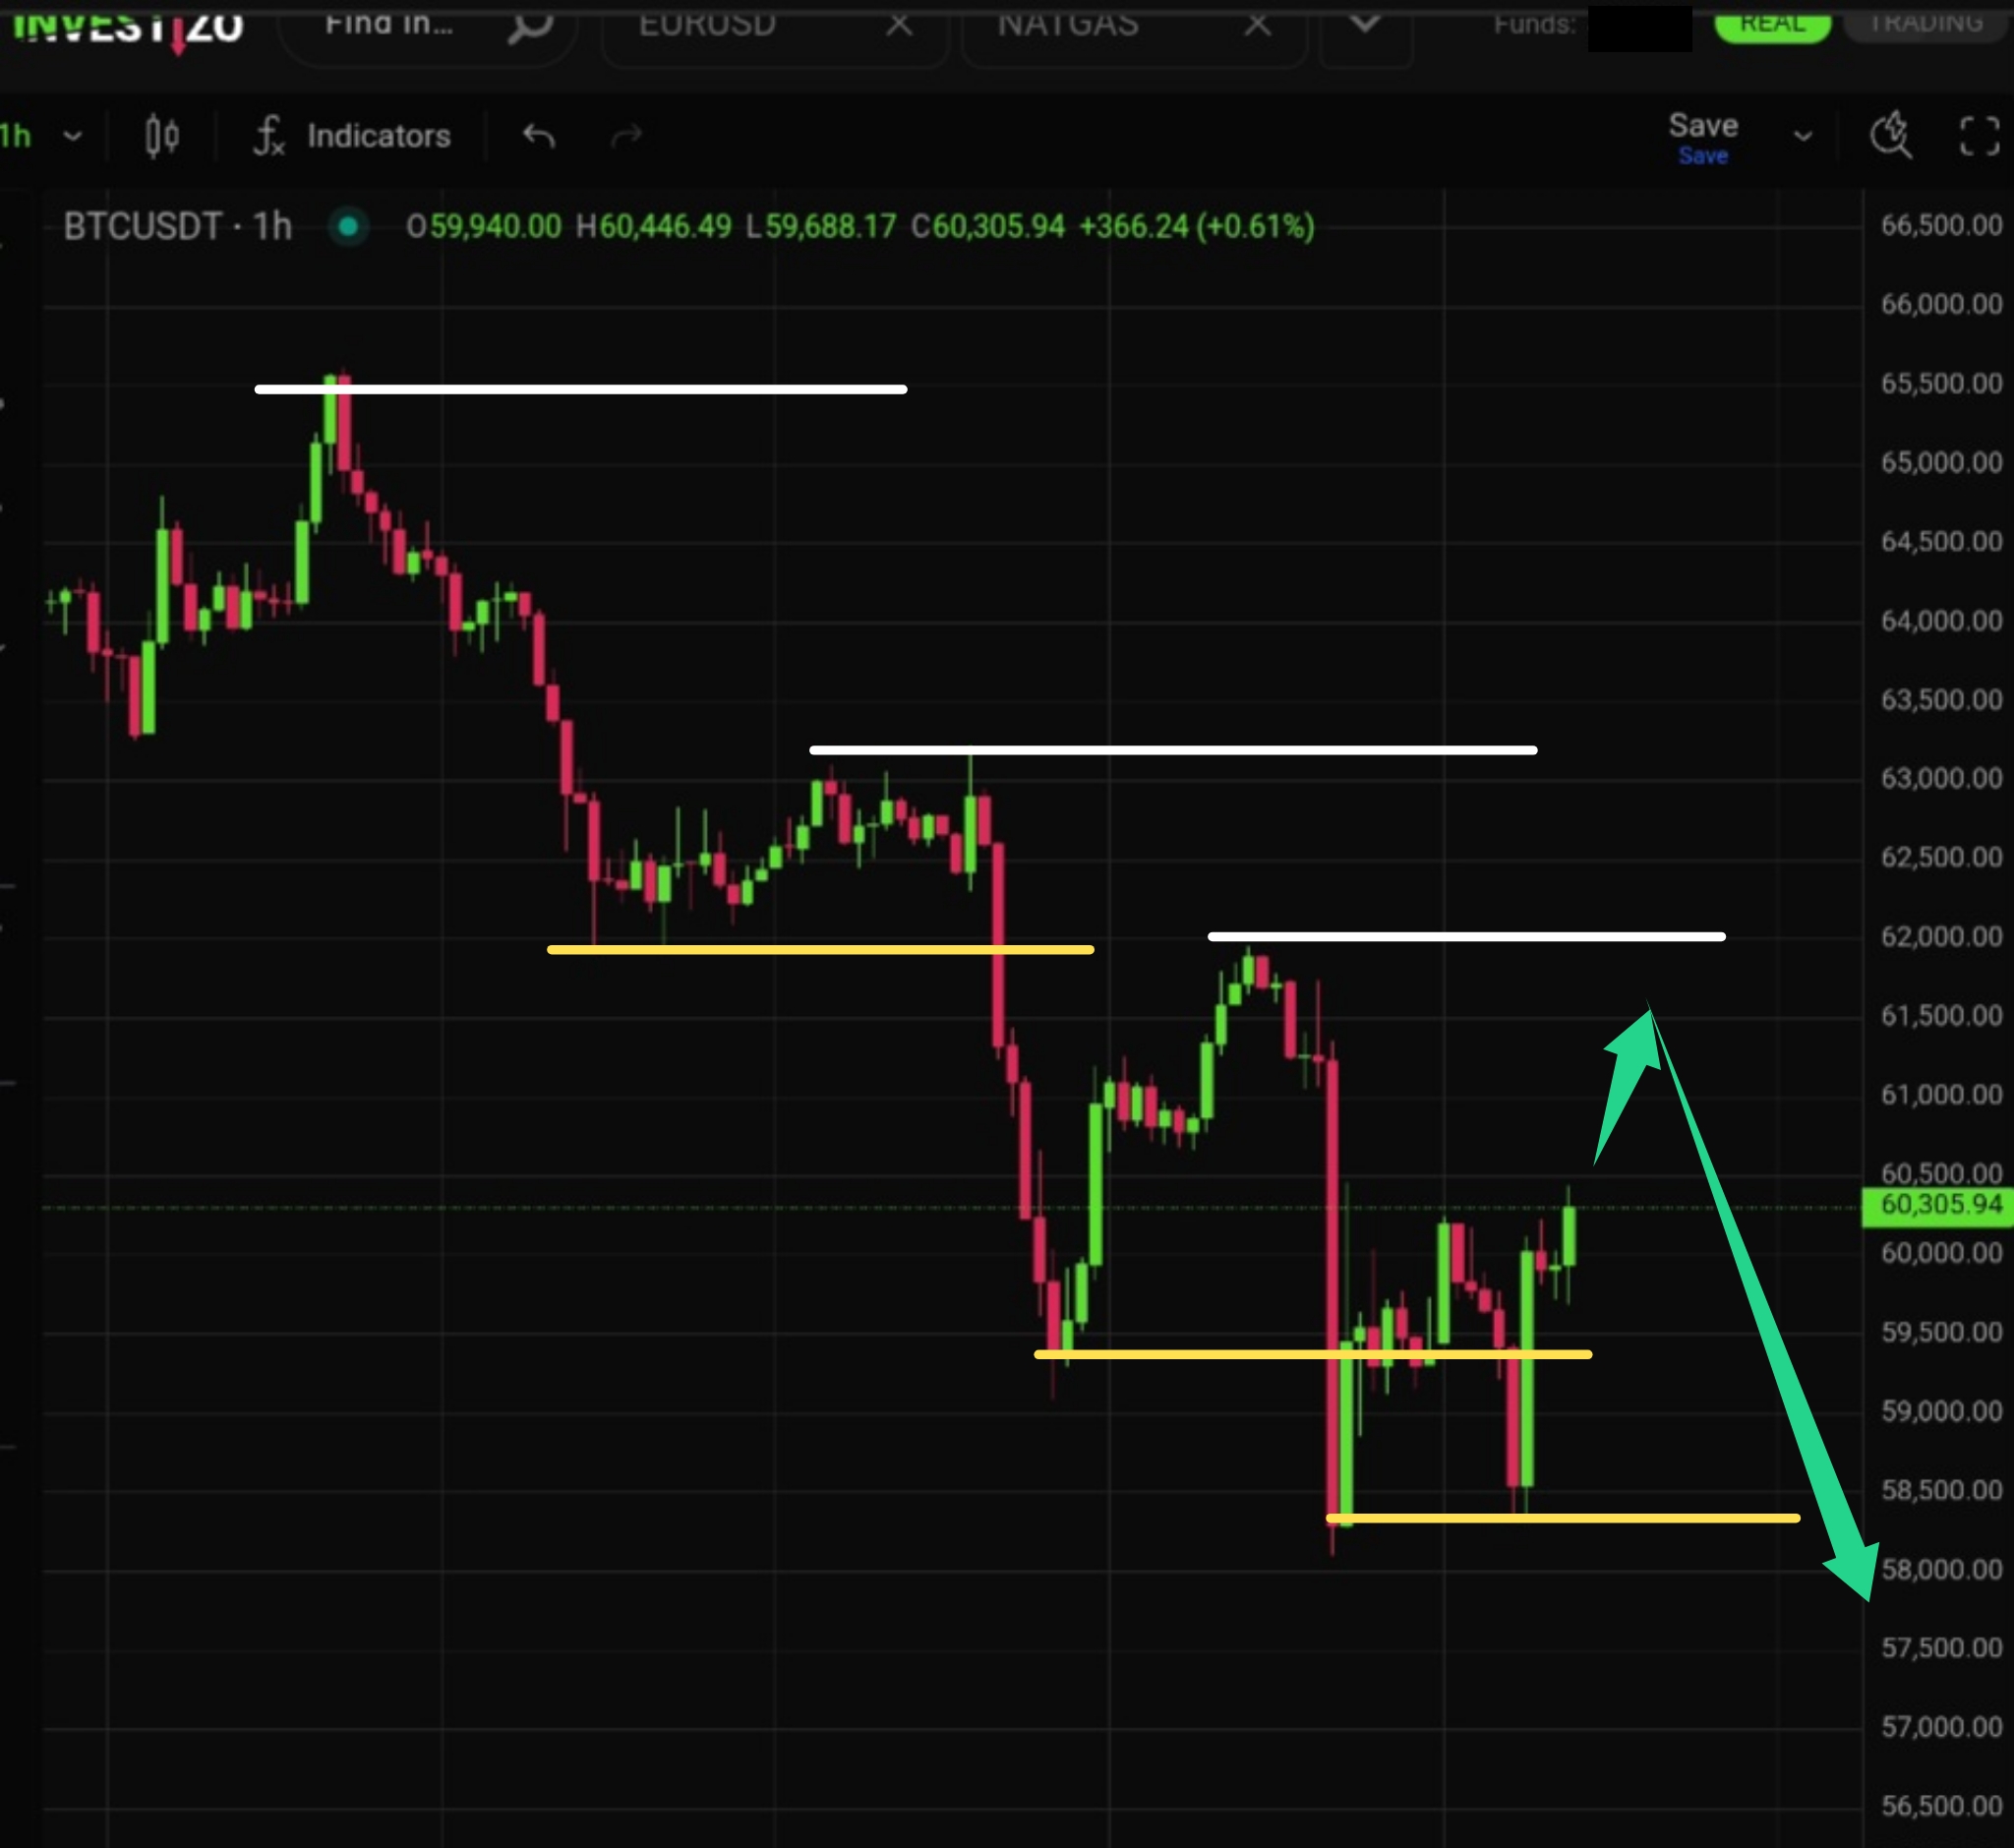
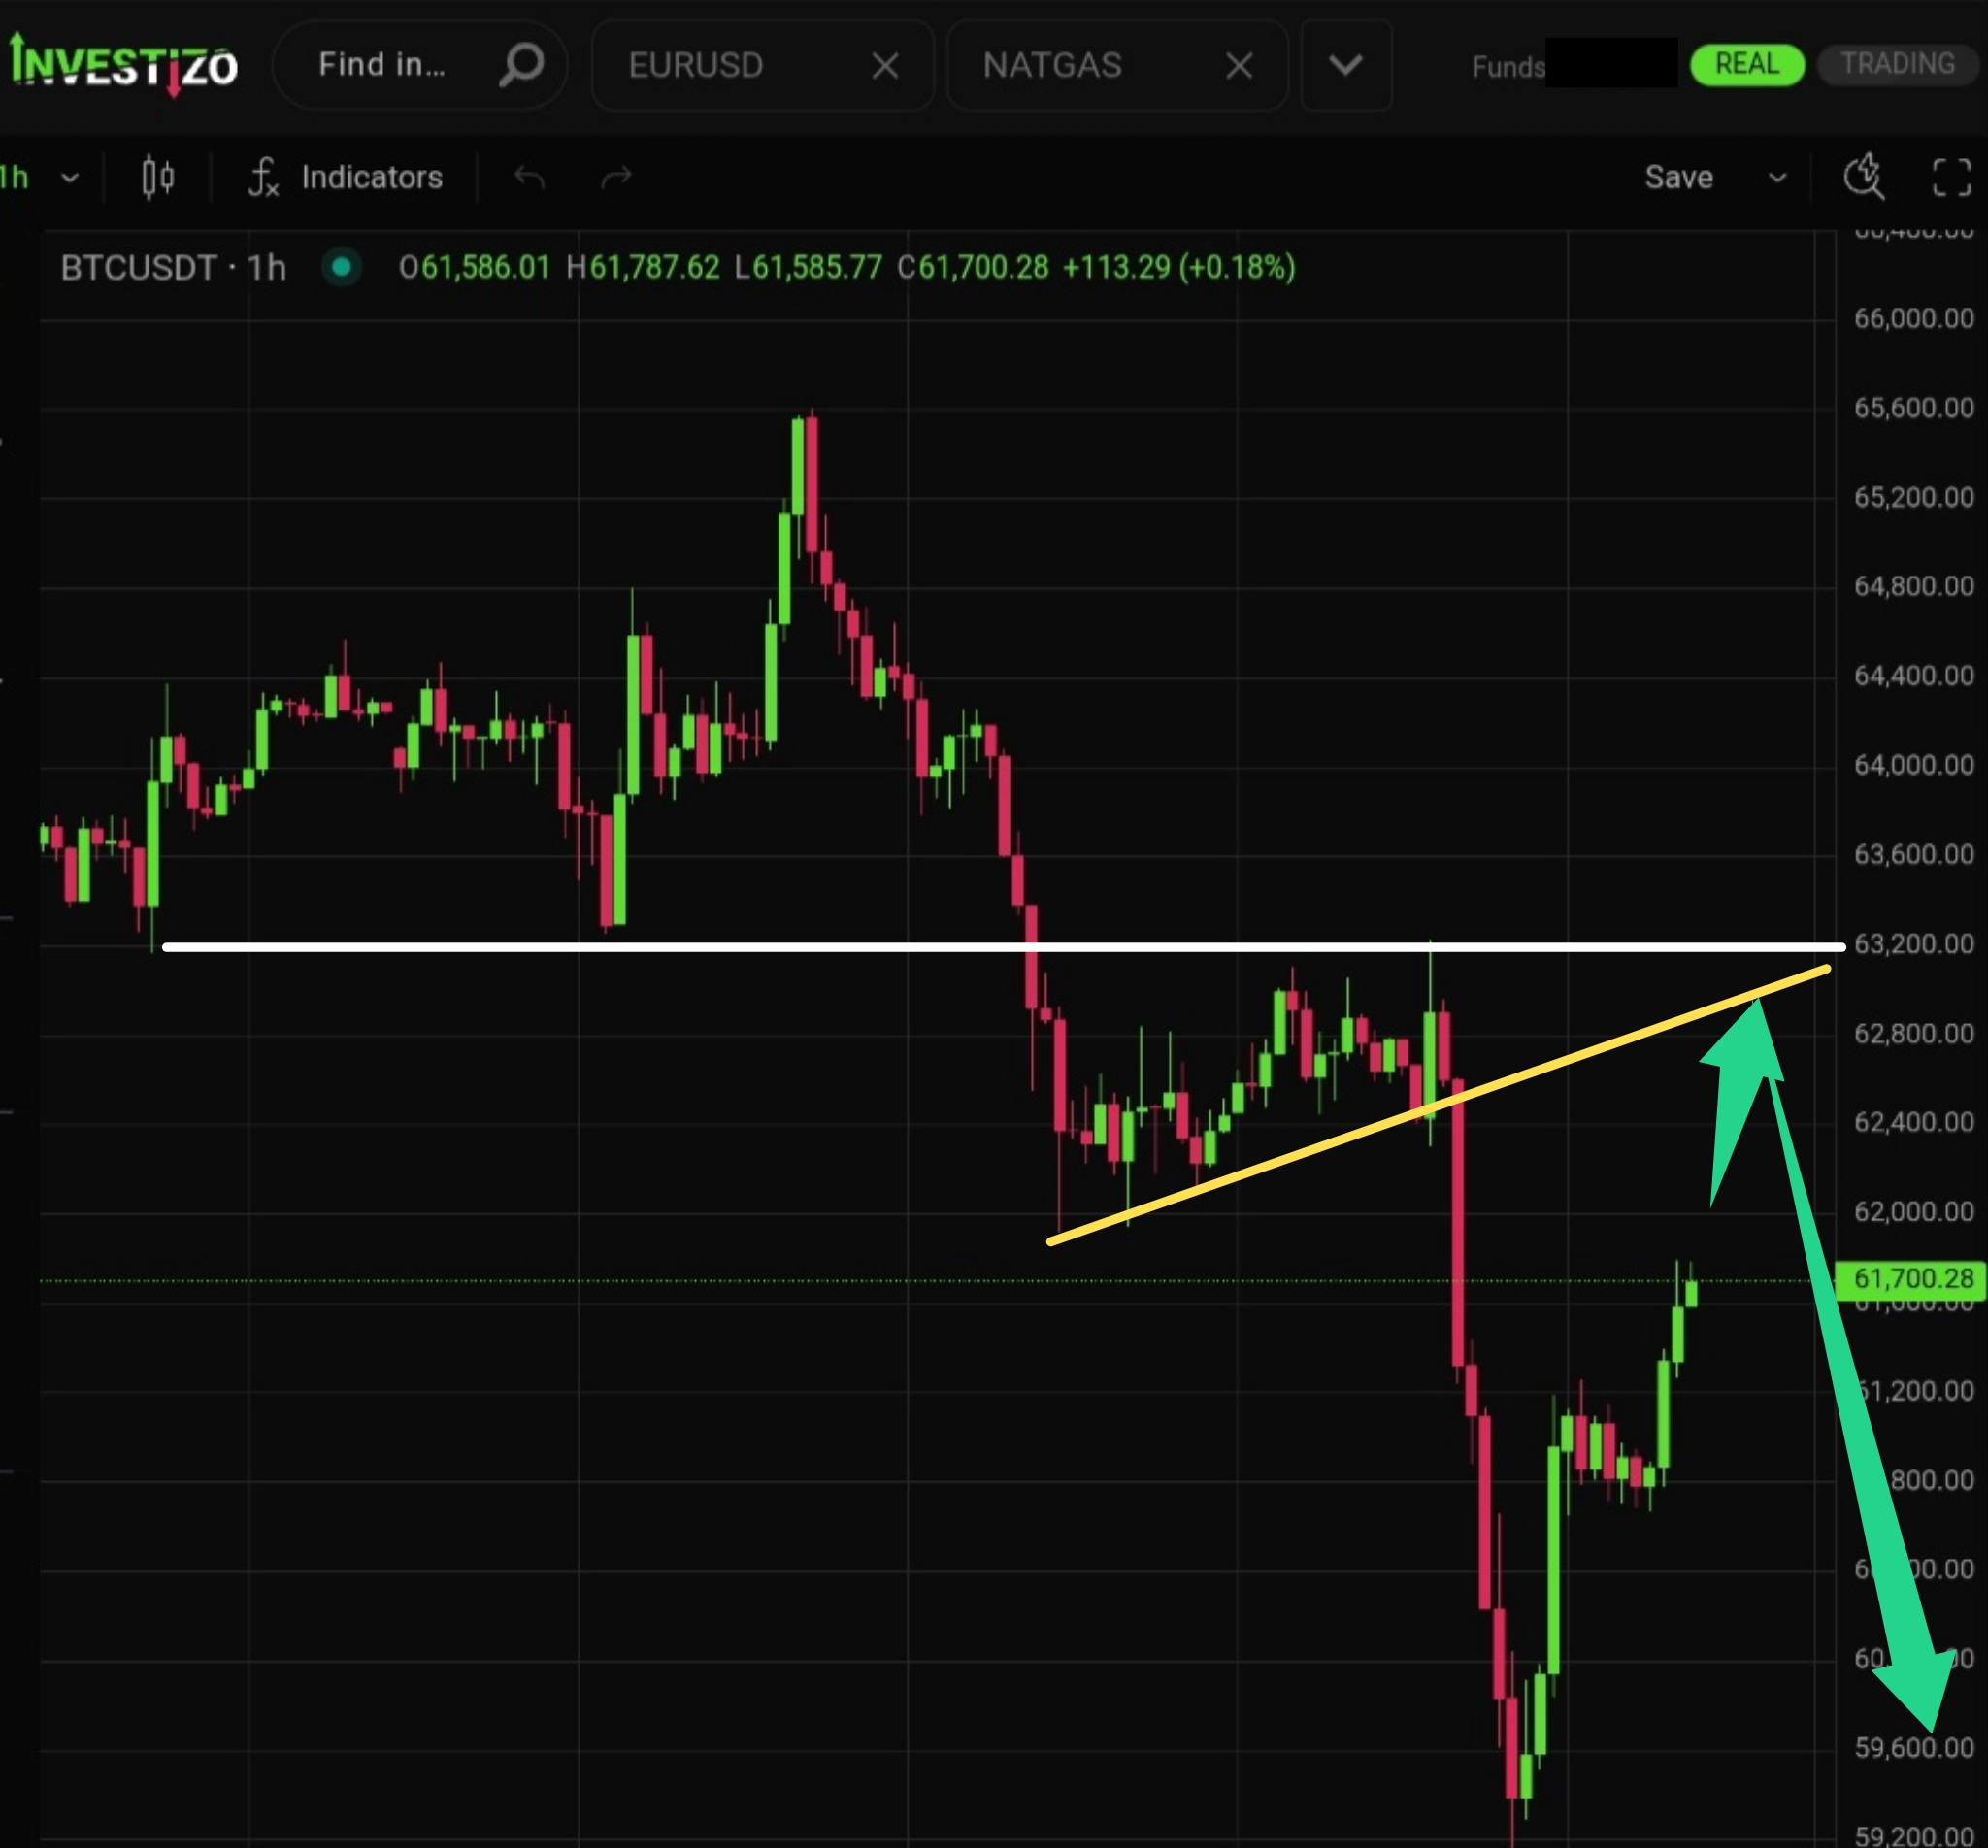
Bitcoin continues to exhibit a classic stepped descending structure. The current upward correction lacks any meaningful bullish signals.
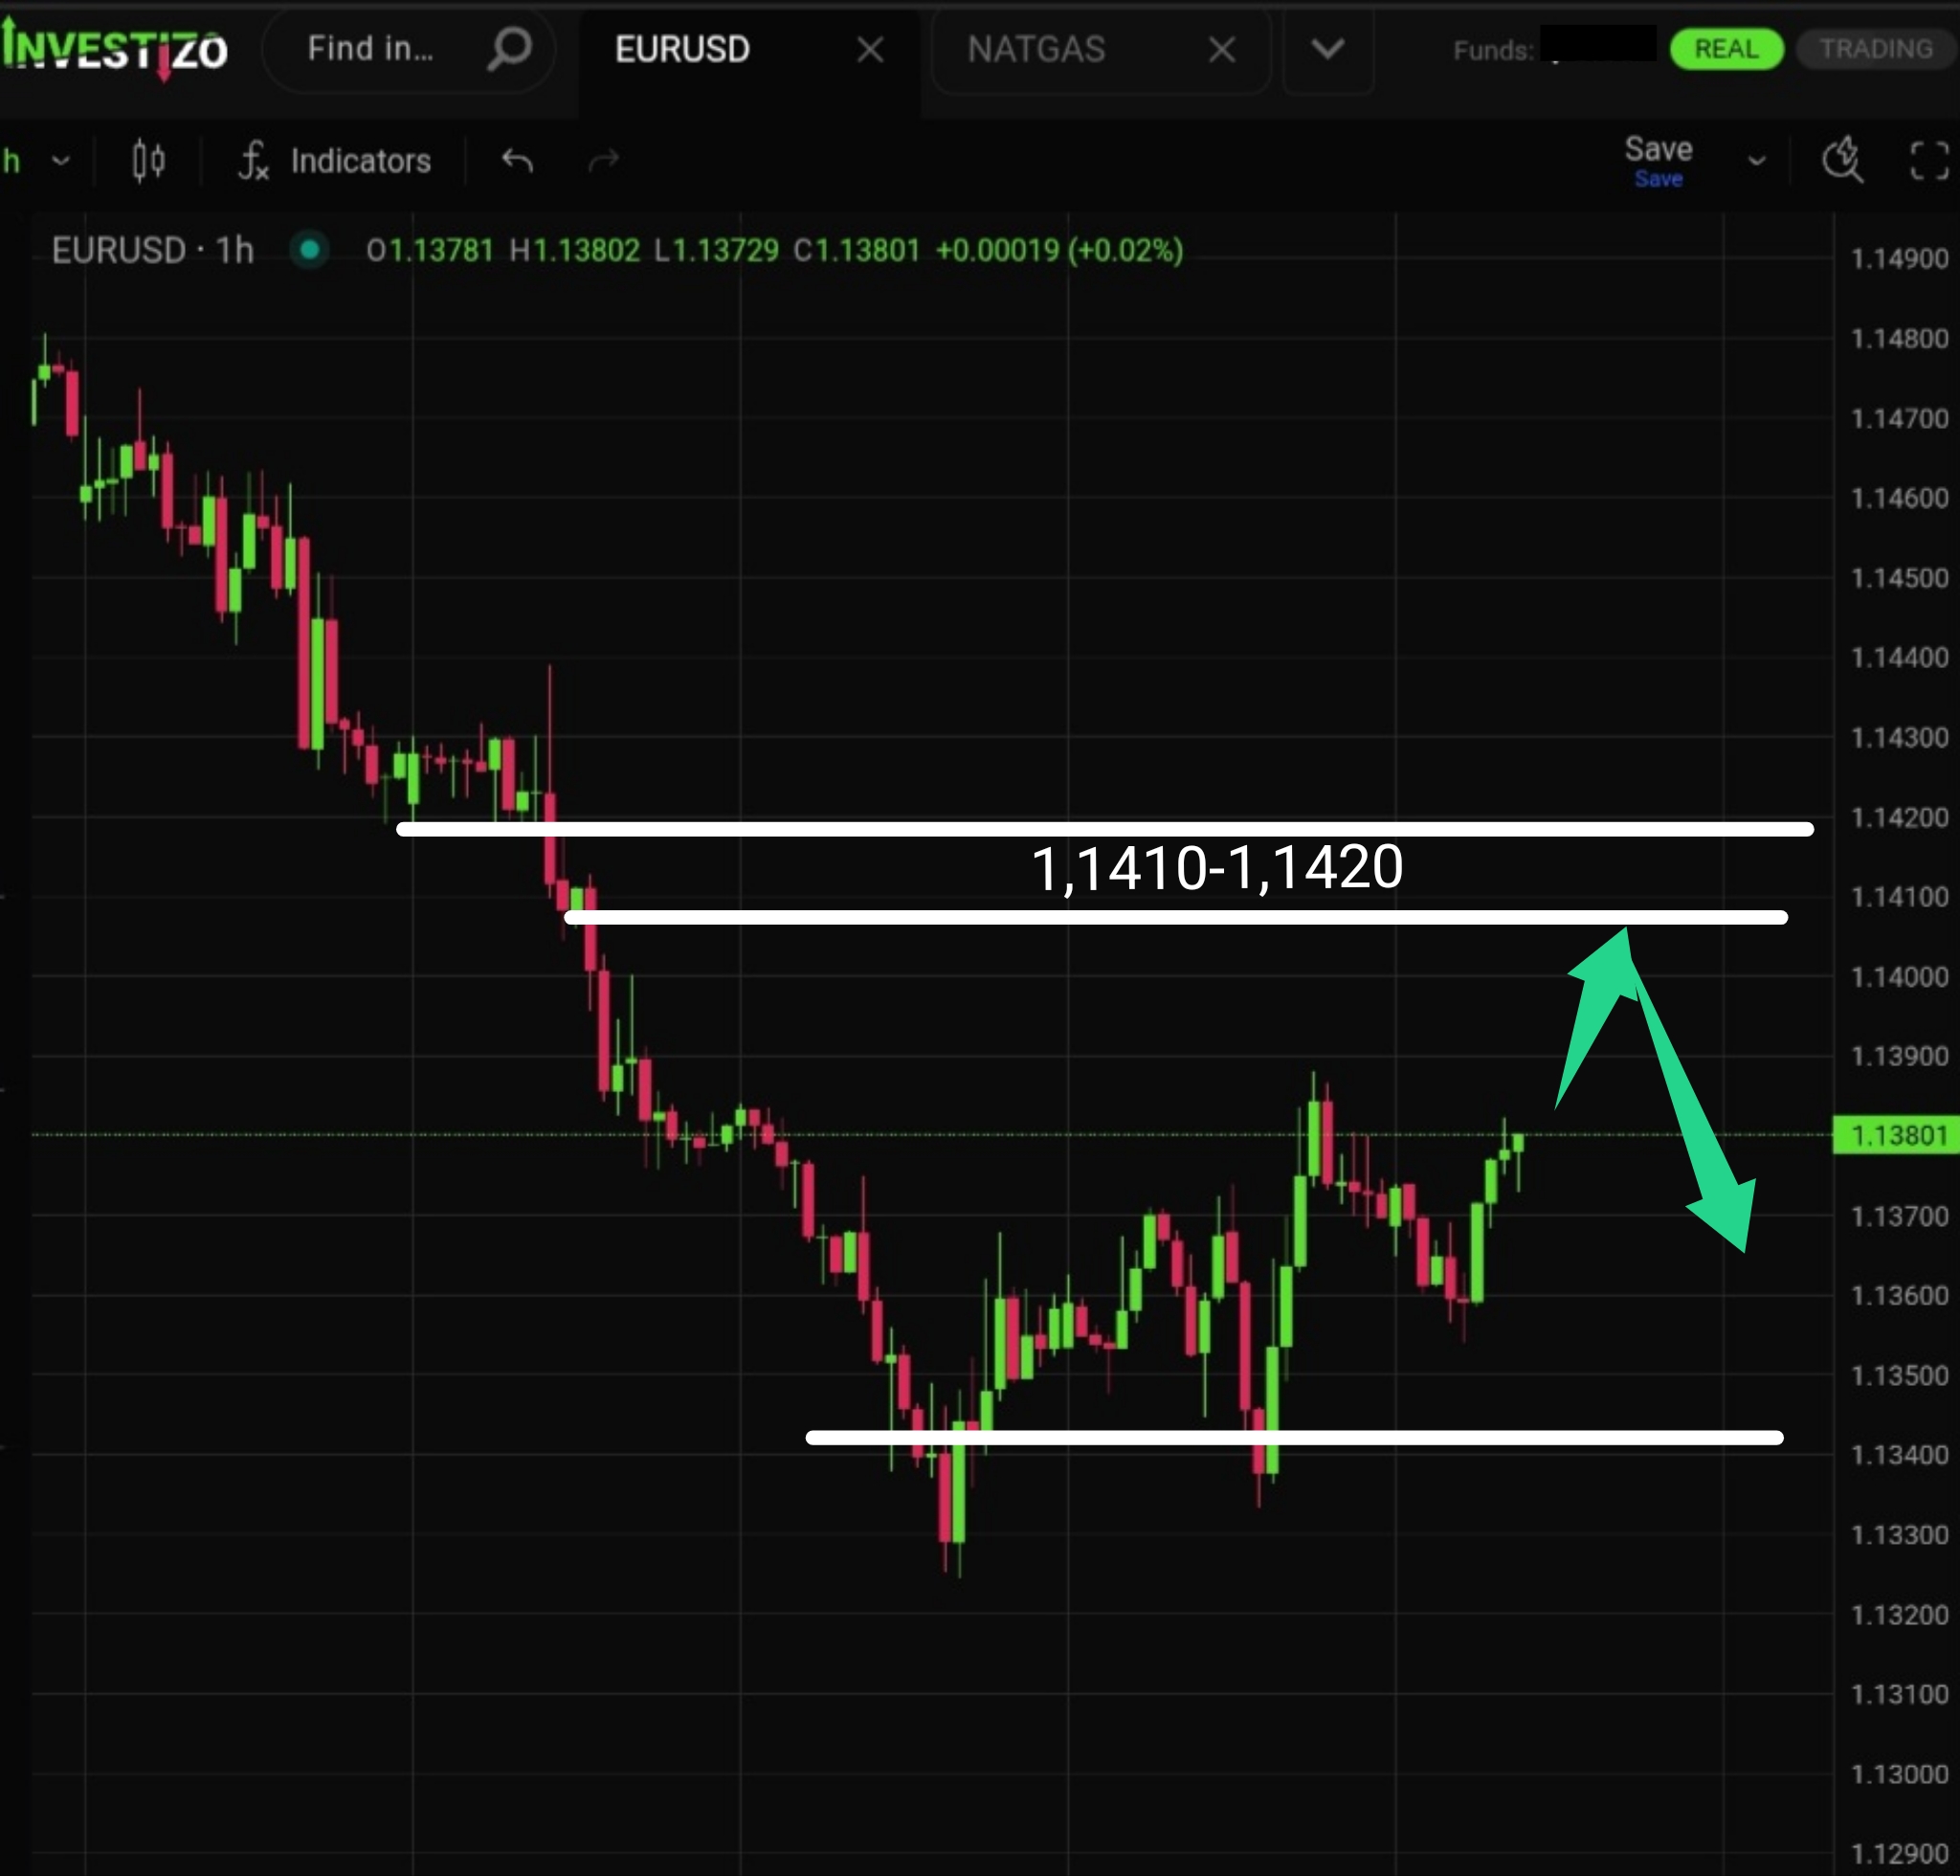
The EUR/USD pair is trading at 1.1380, reflecting tight intraday consolidation as institutional desks digest a vital set of macroeconomic indicators and monetary policy signals from both sides of the Atlantic.
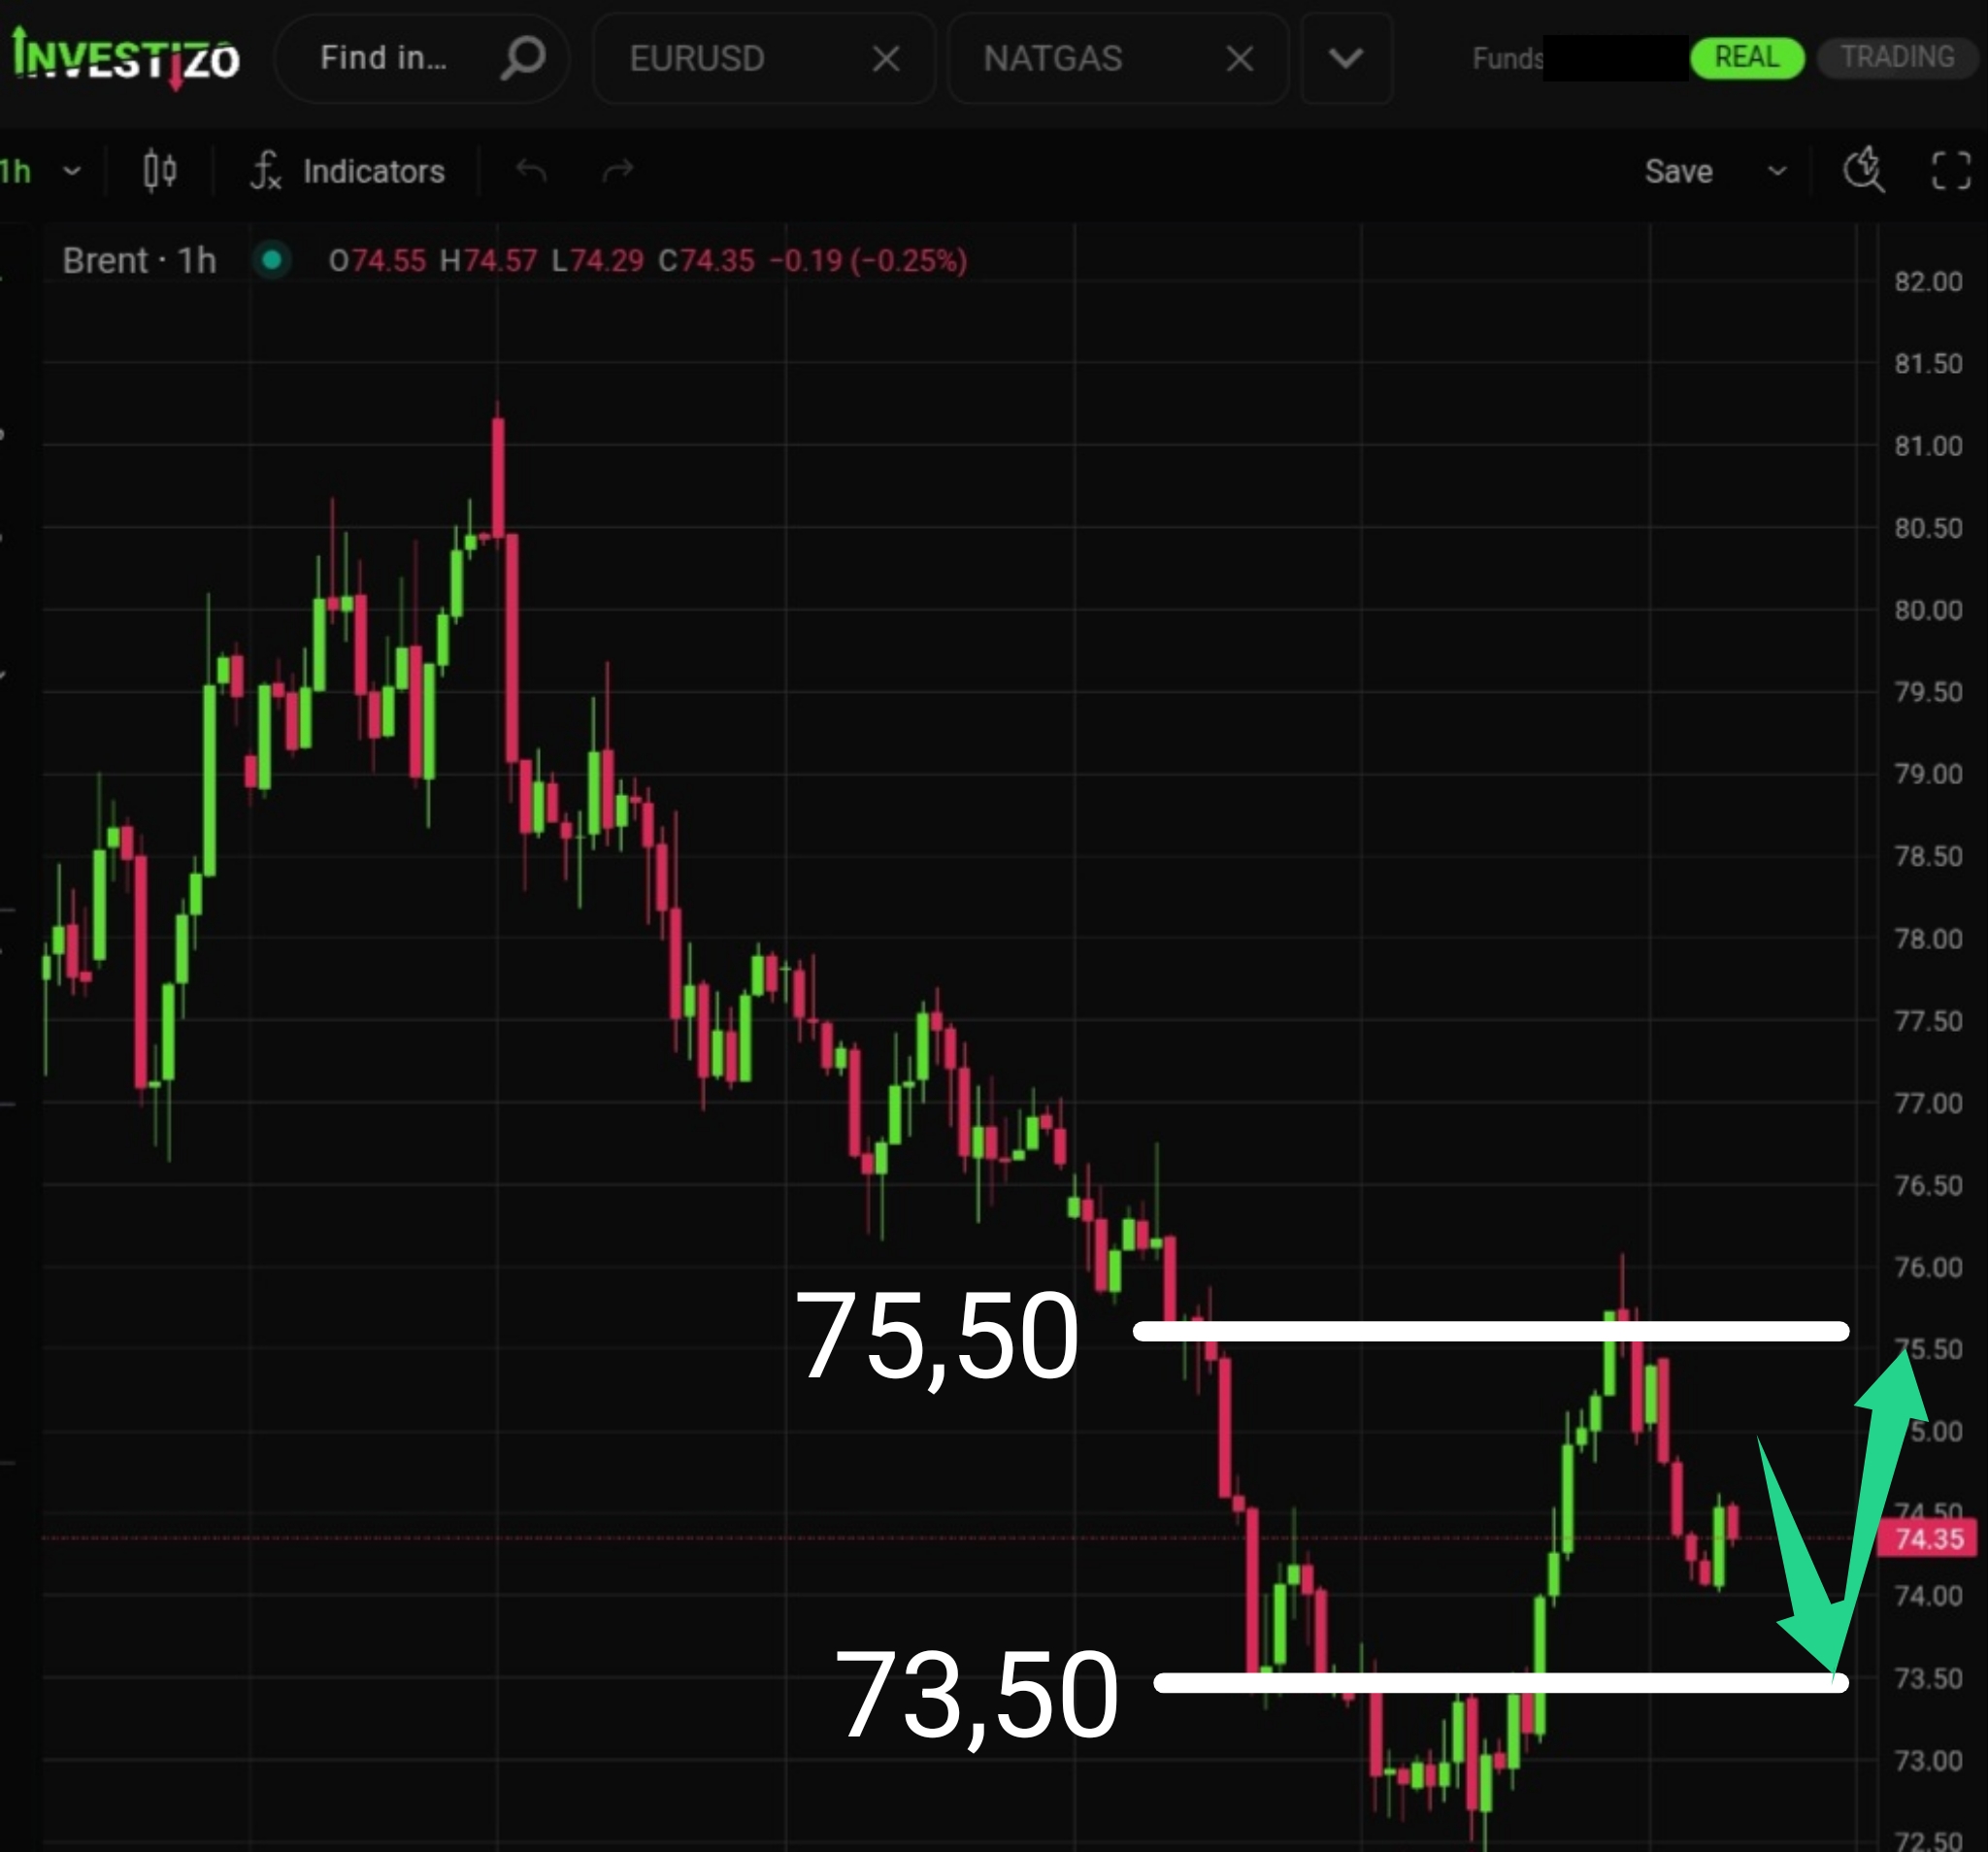
Brent crude is trading at $74.35 per barrel, consolidating just below the psychological $75.00 threshold as a volatile 24-hour cycle highlights the intense tug-of-war between structural physical oversupply and immediate geopolitical risk premiums.
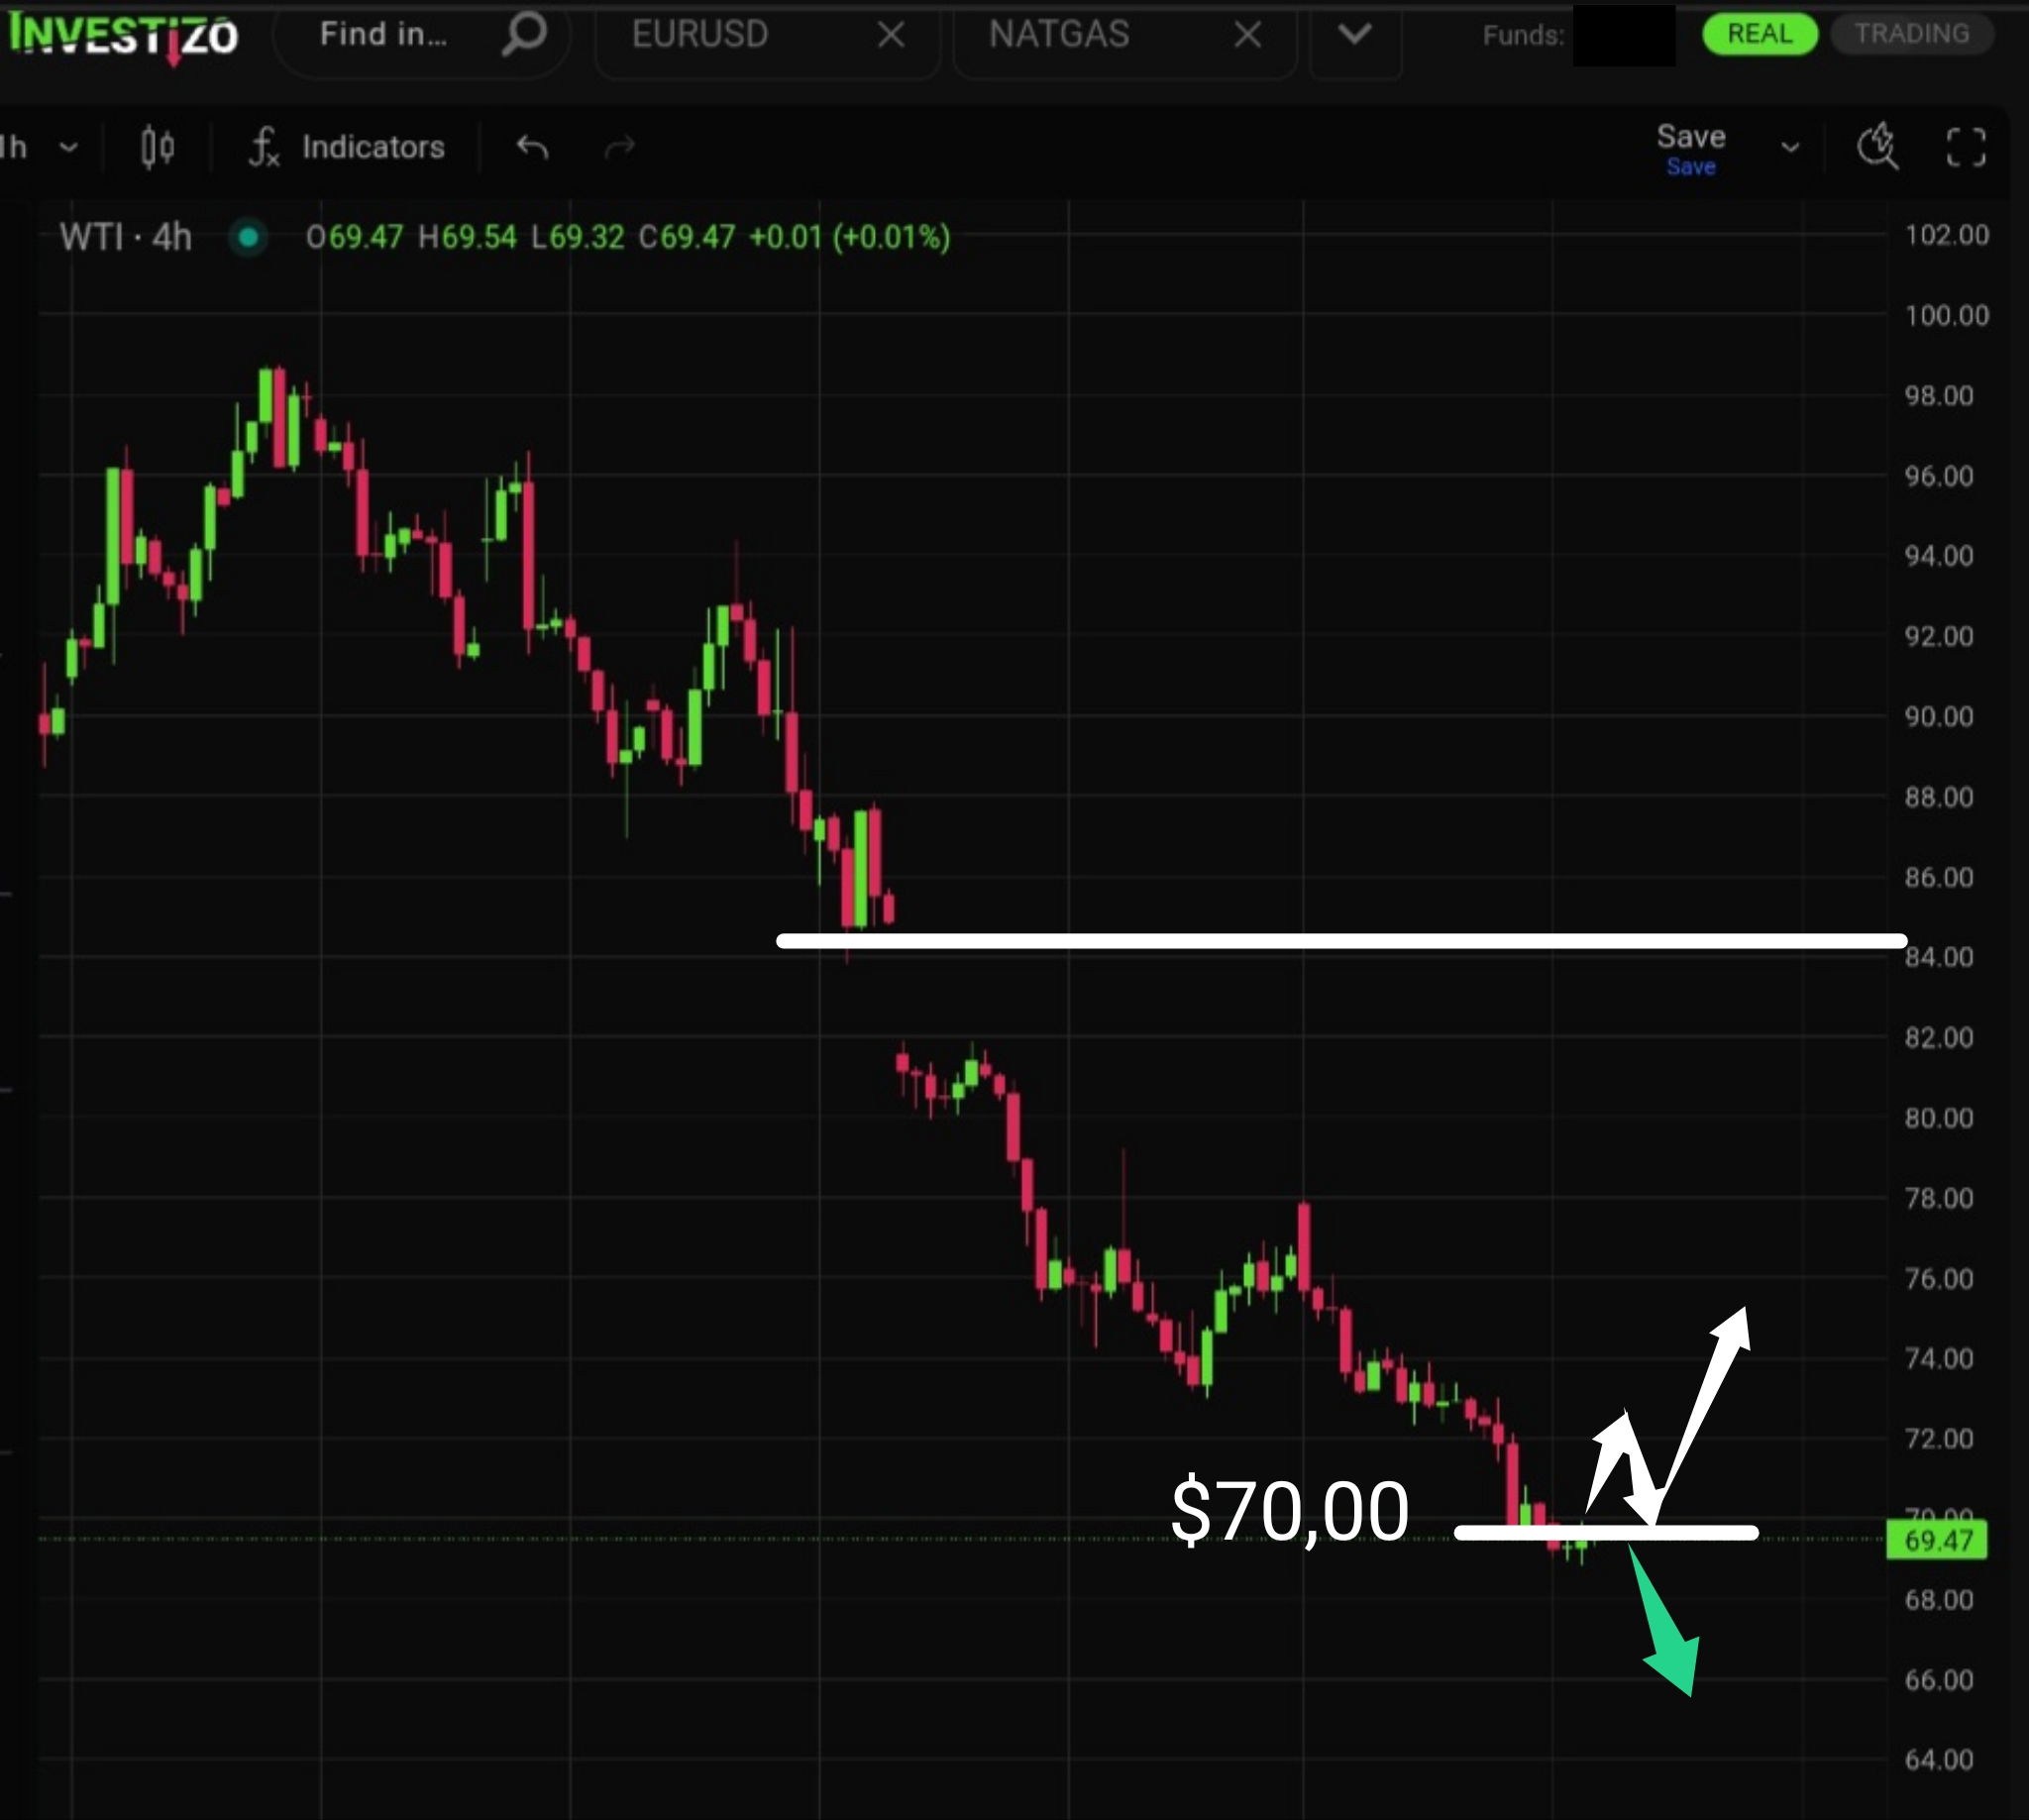
Oil remains in a clear and undisputed downtrend. However, an unfilled gap around $84.20 may act as a catalyst for a corrective bounce.
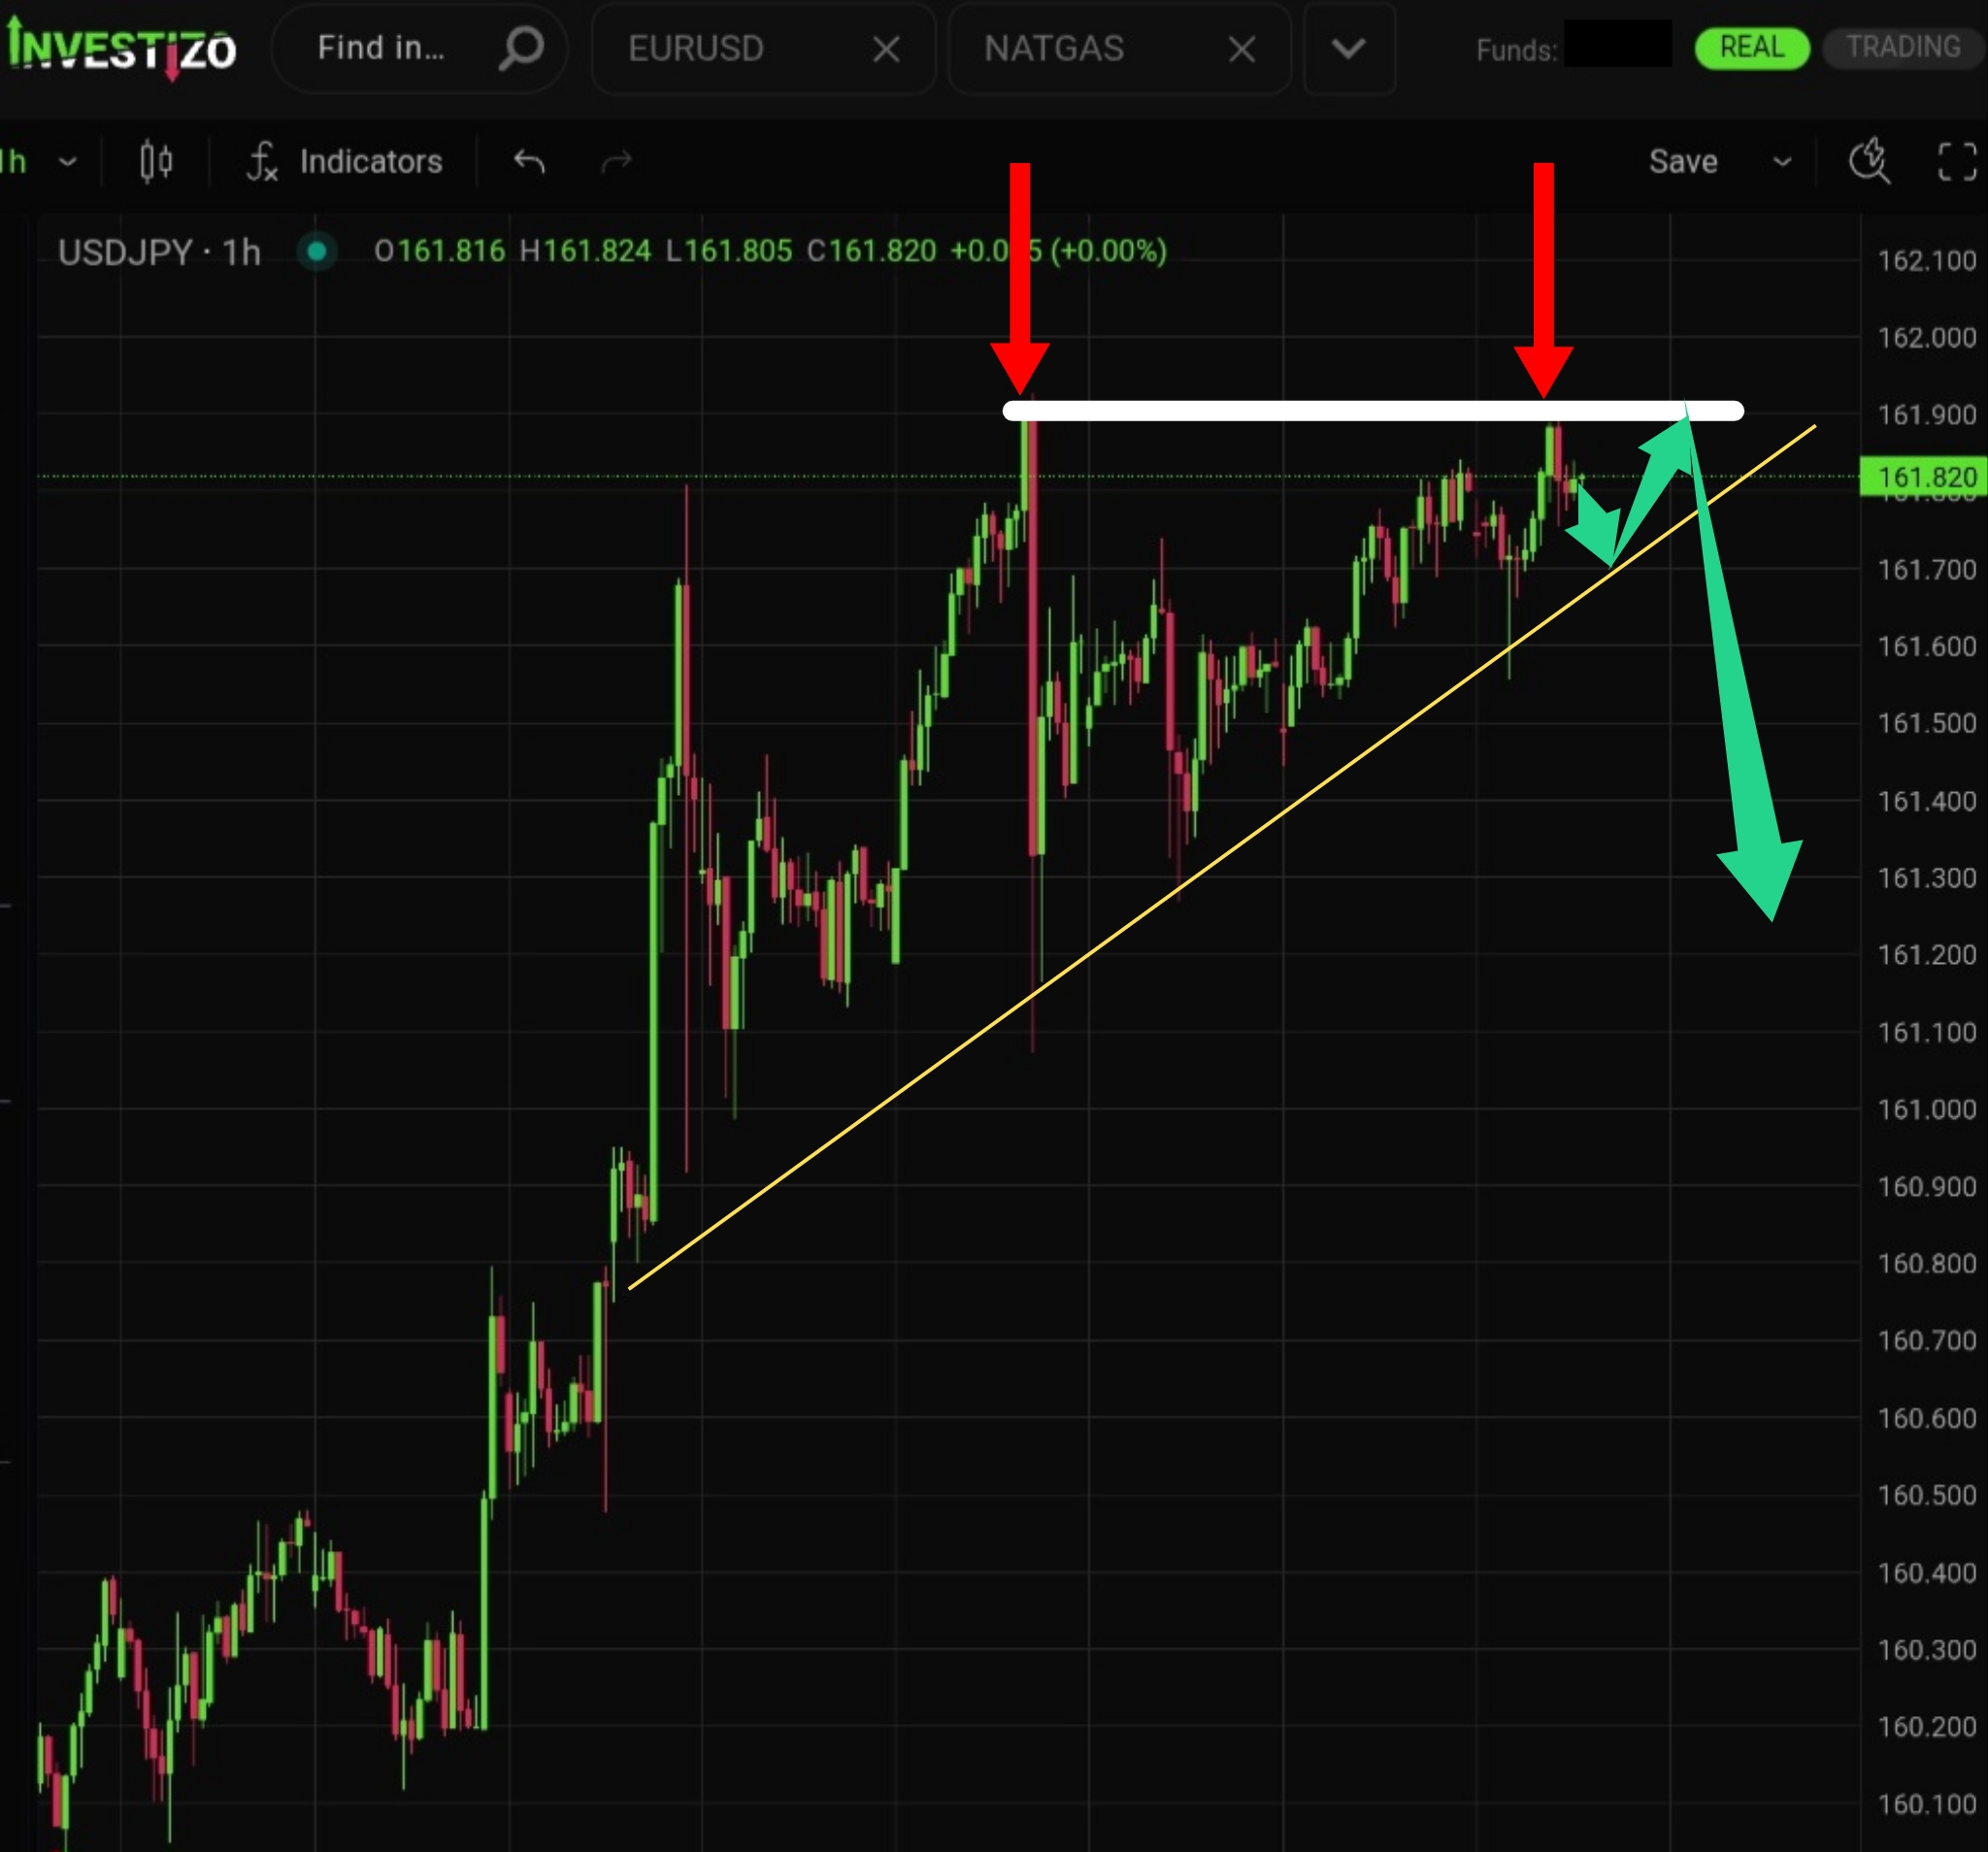
The pair continues to consolidate inside an extremely narrow triangular range, with progressively less room remaining.
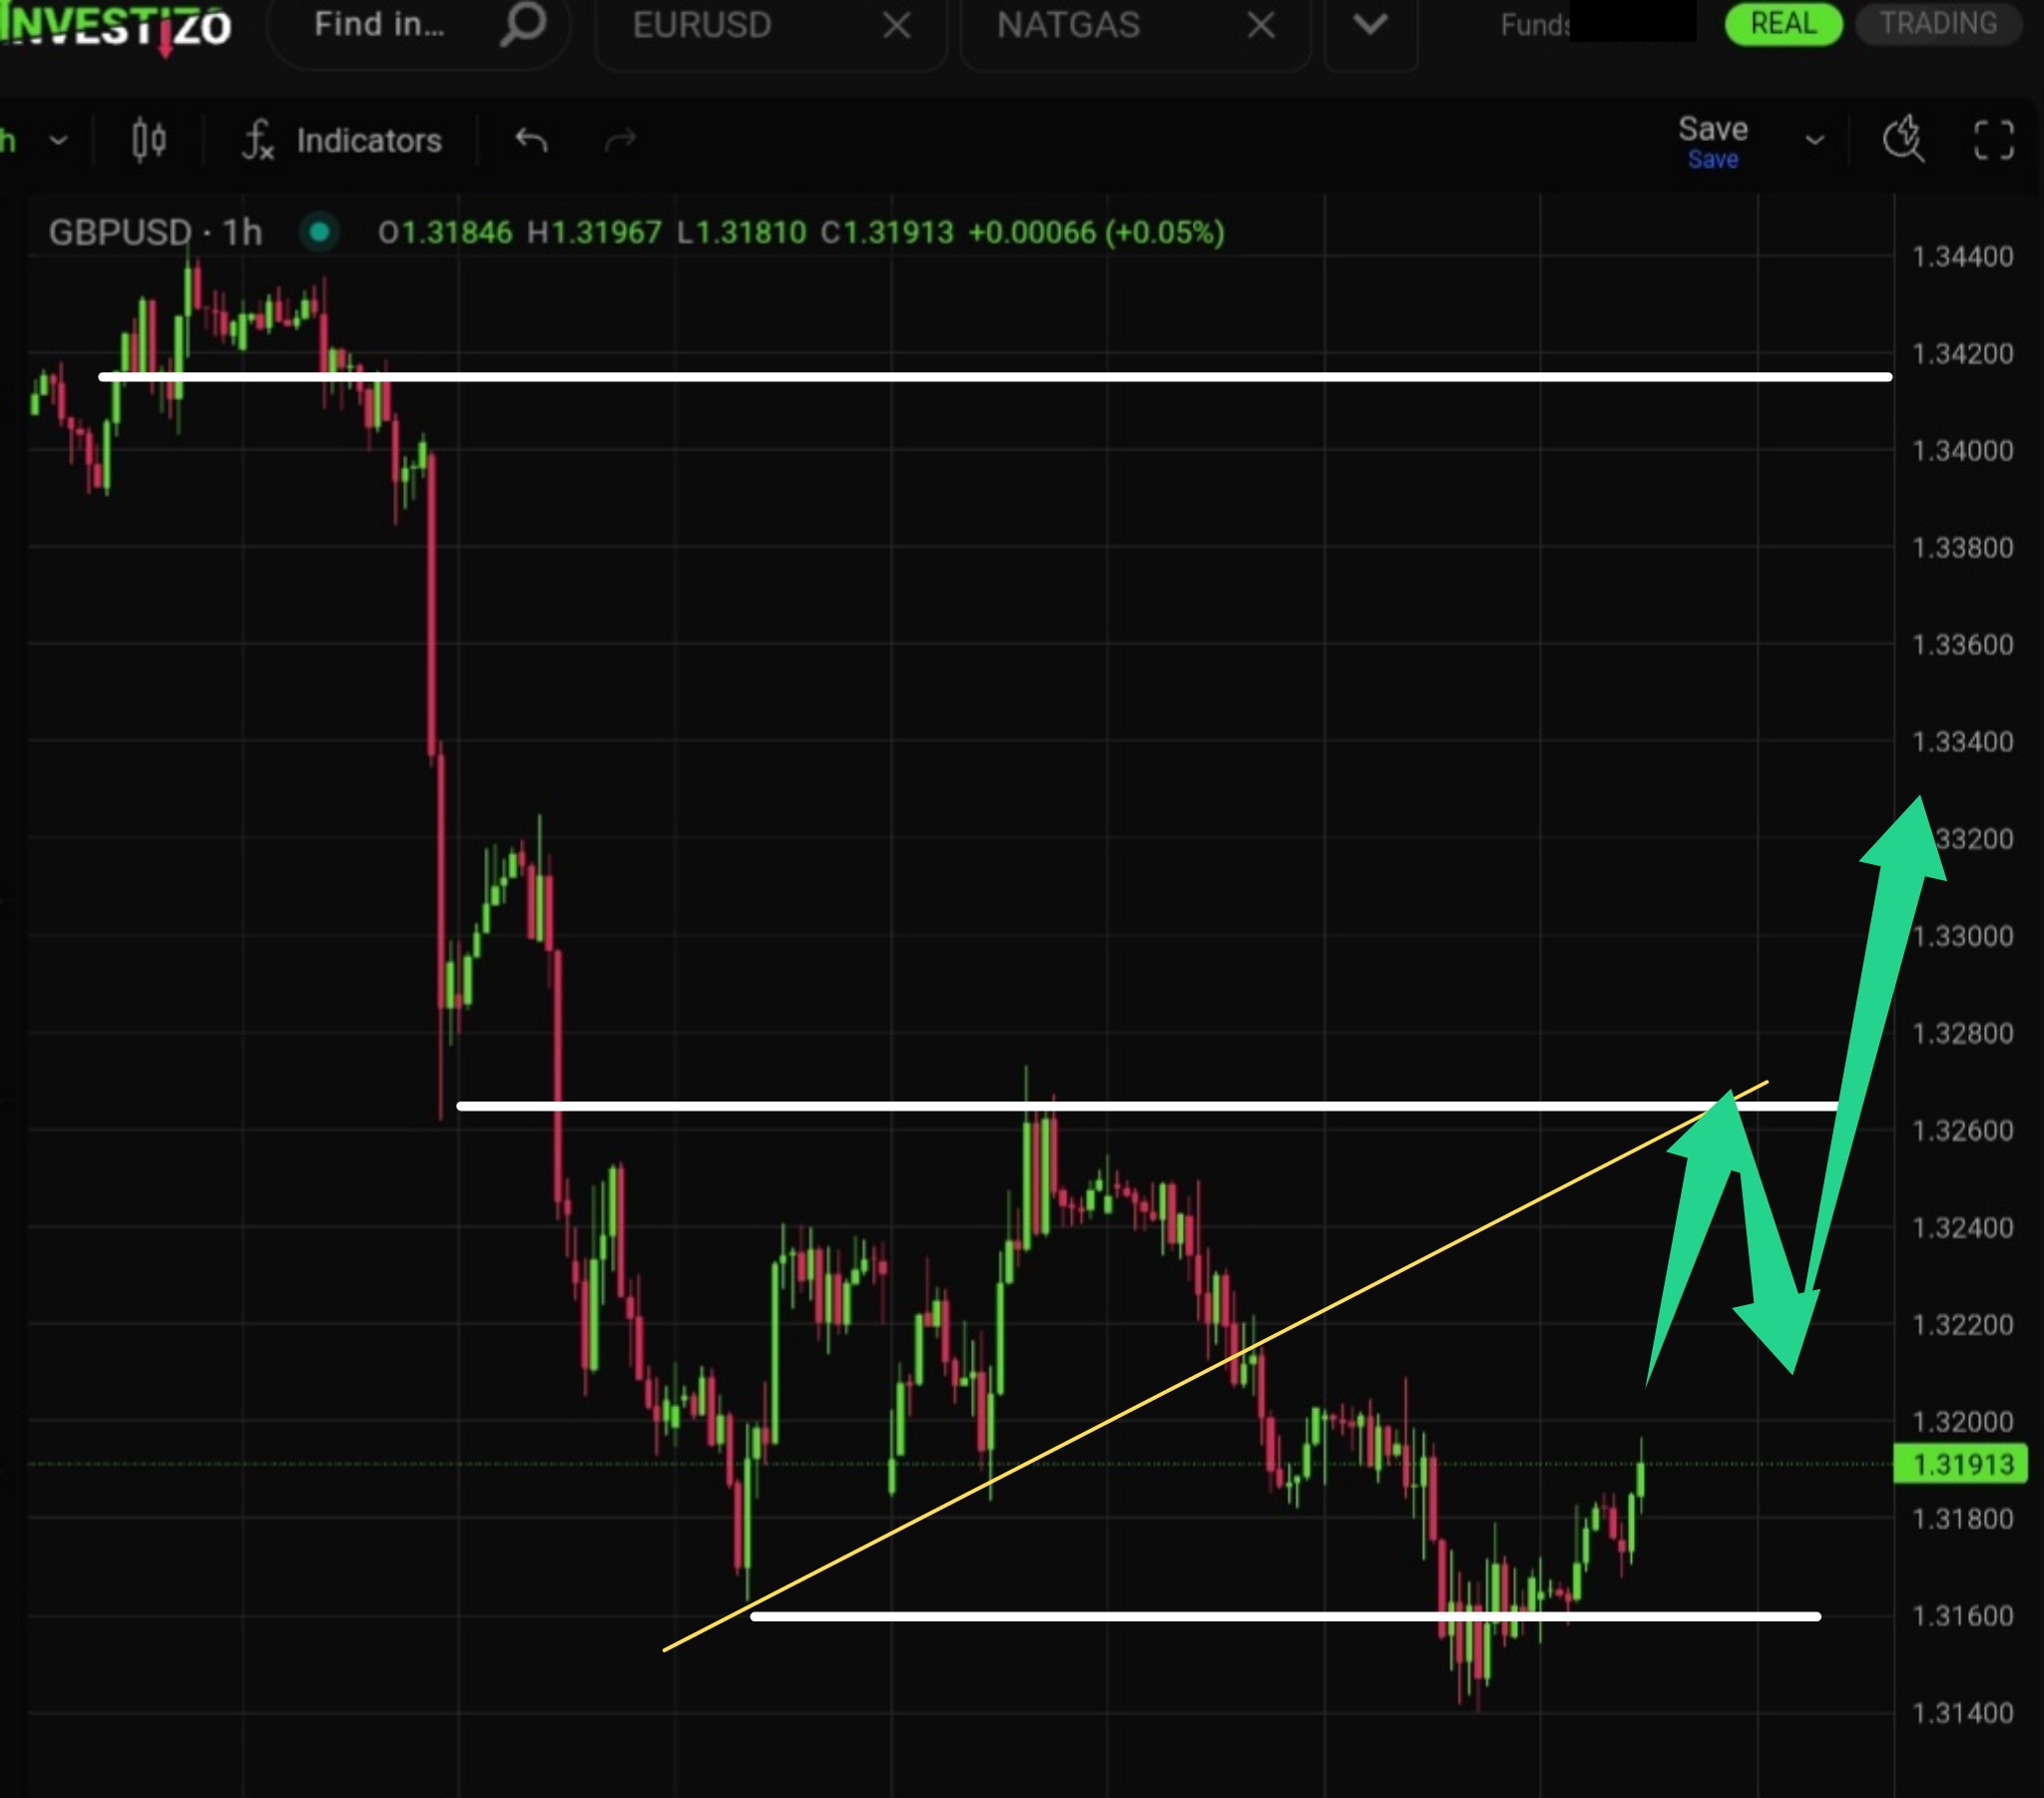
The pair is developing a new upward trend swing. A recovery toward the 1.3400–1.3410 area can be expected.
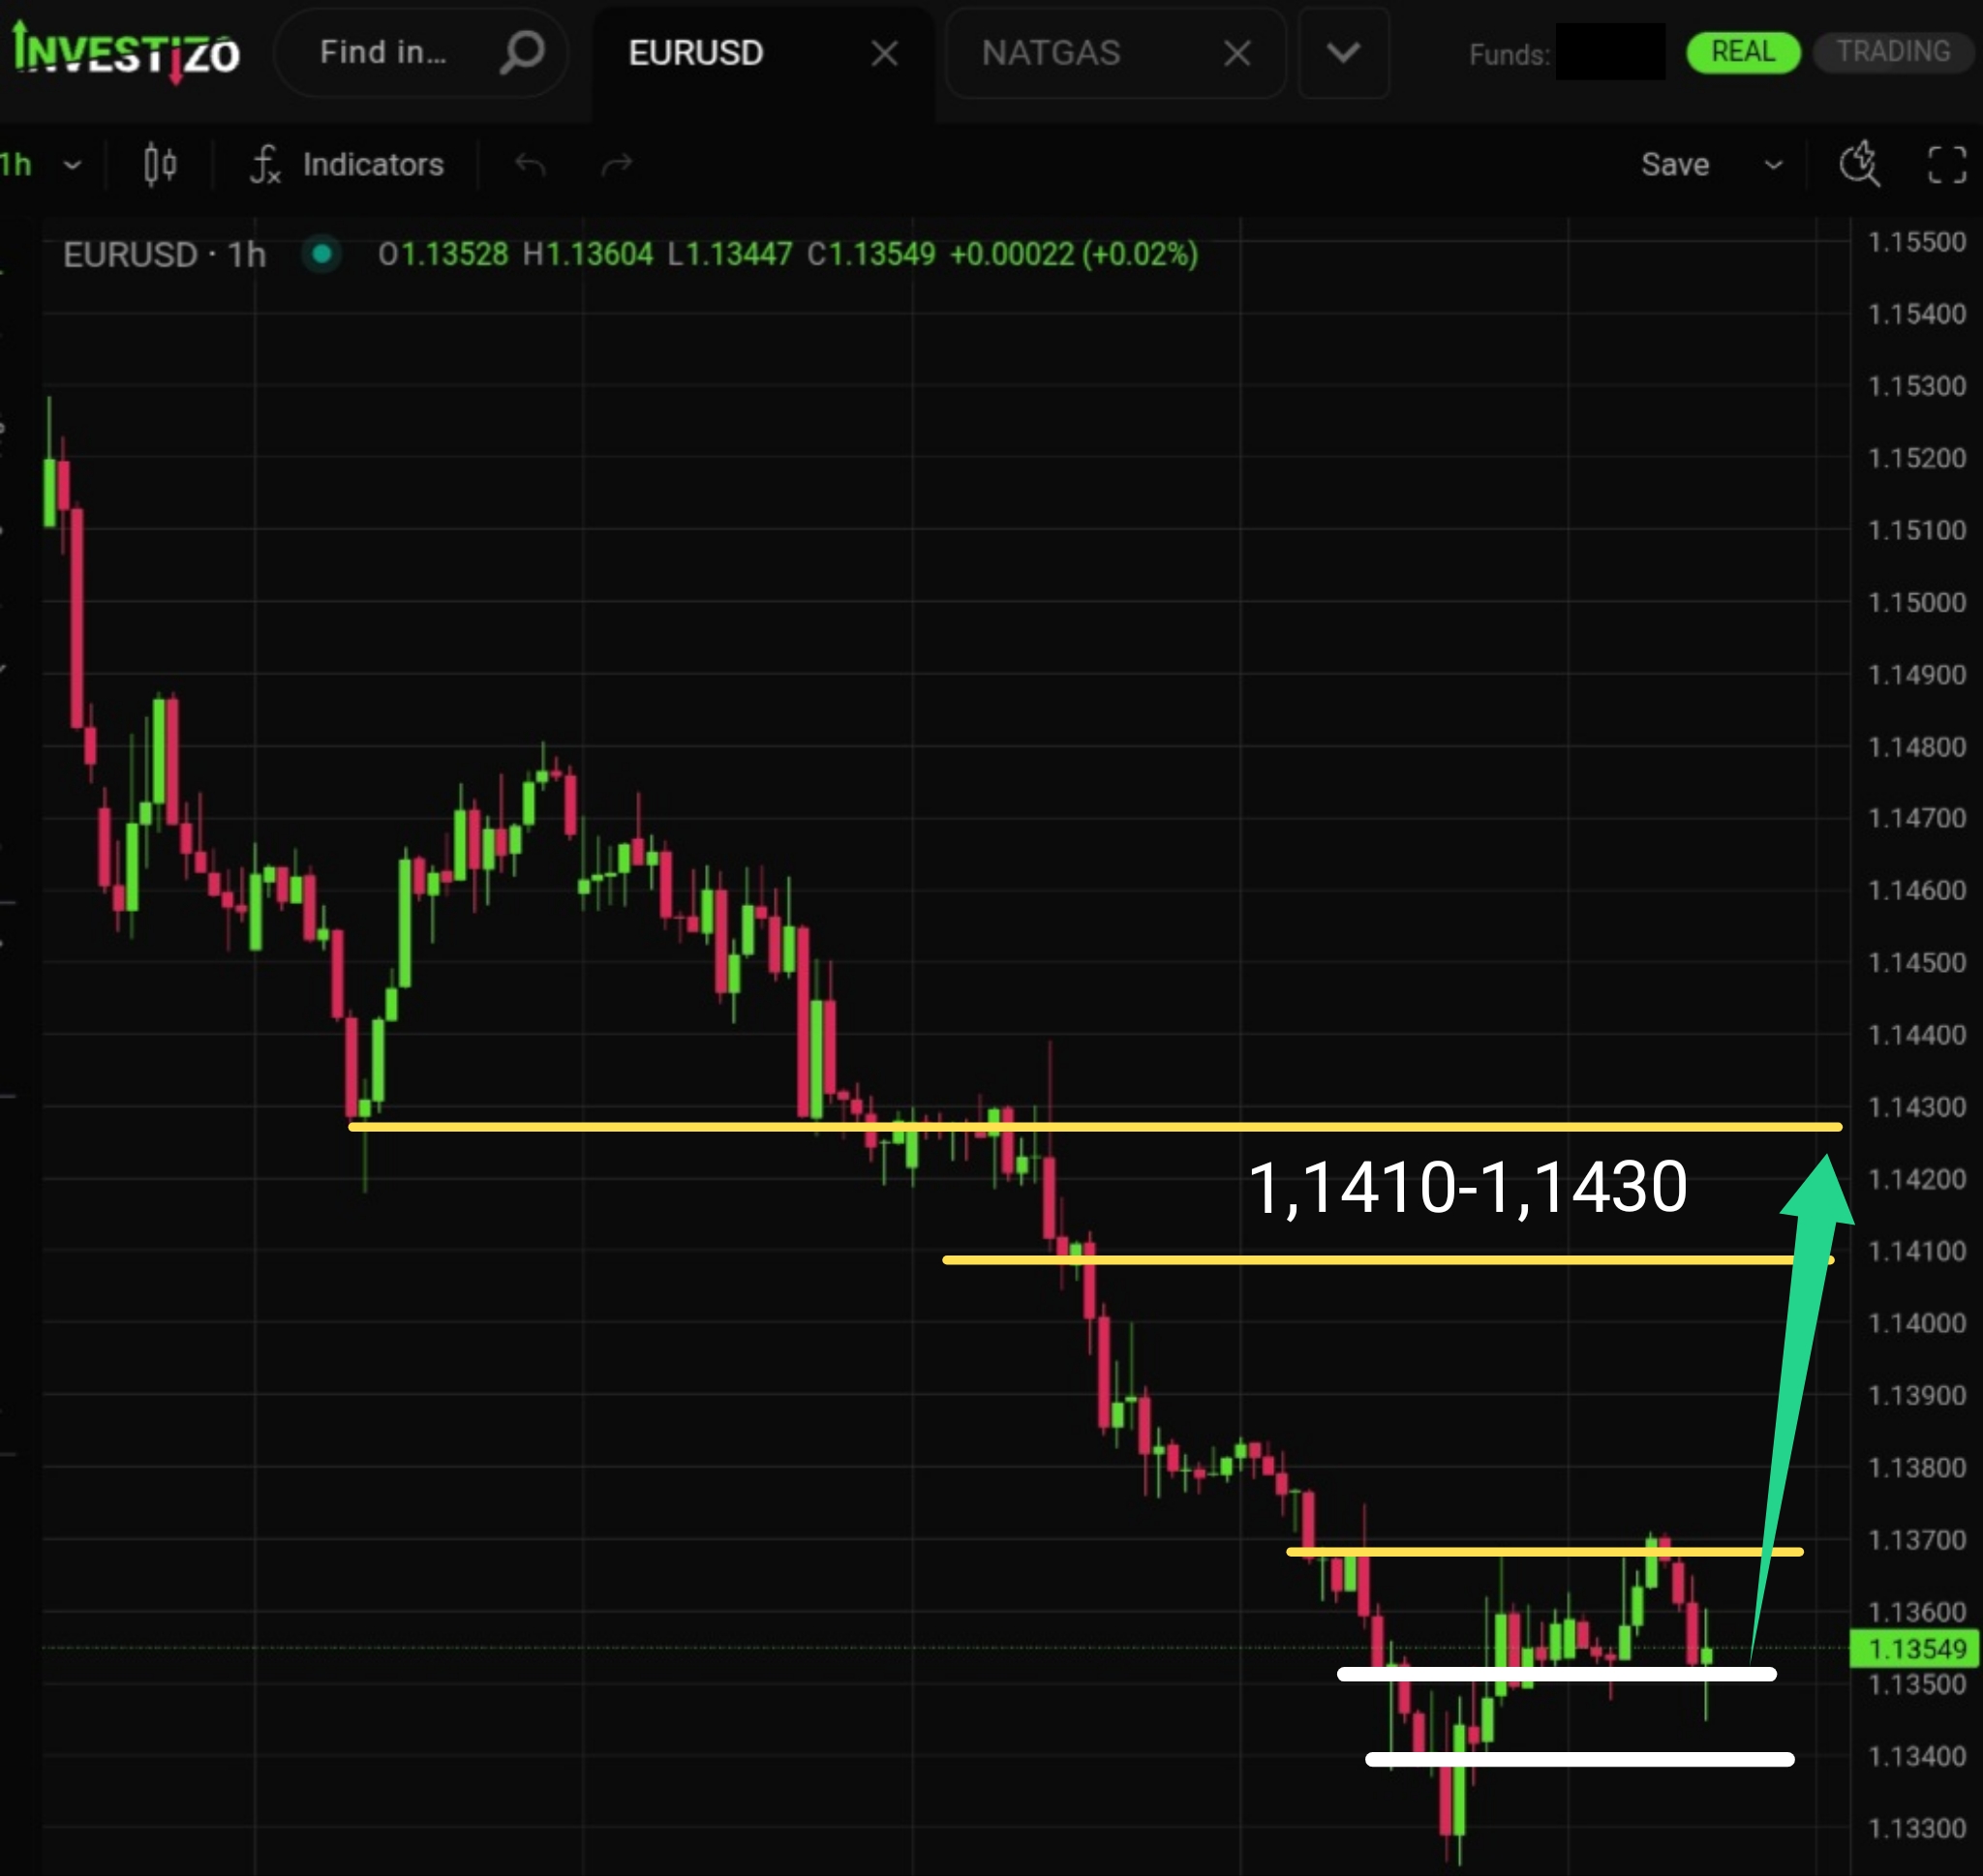
A clear upward reversal has formed, with prospects for a dynamic euro recovery toward the 1.1410–1.1430 area.
The market has refreshed its local low below the key psychological level of $60,000 and subsequently began the traditional squeeze of late short-sellers.
Spot gold has broken below the critical psychological threshold, currently trading down at $3,981 per ounce after a violent 3% liquidation in the previous session.
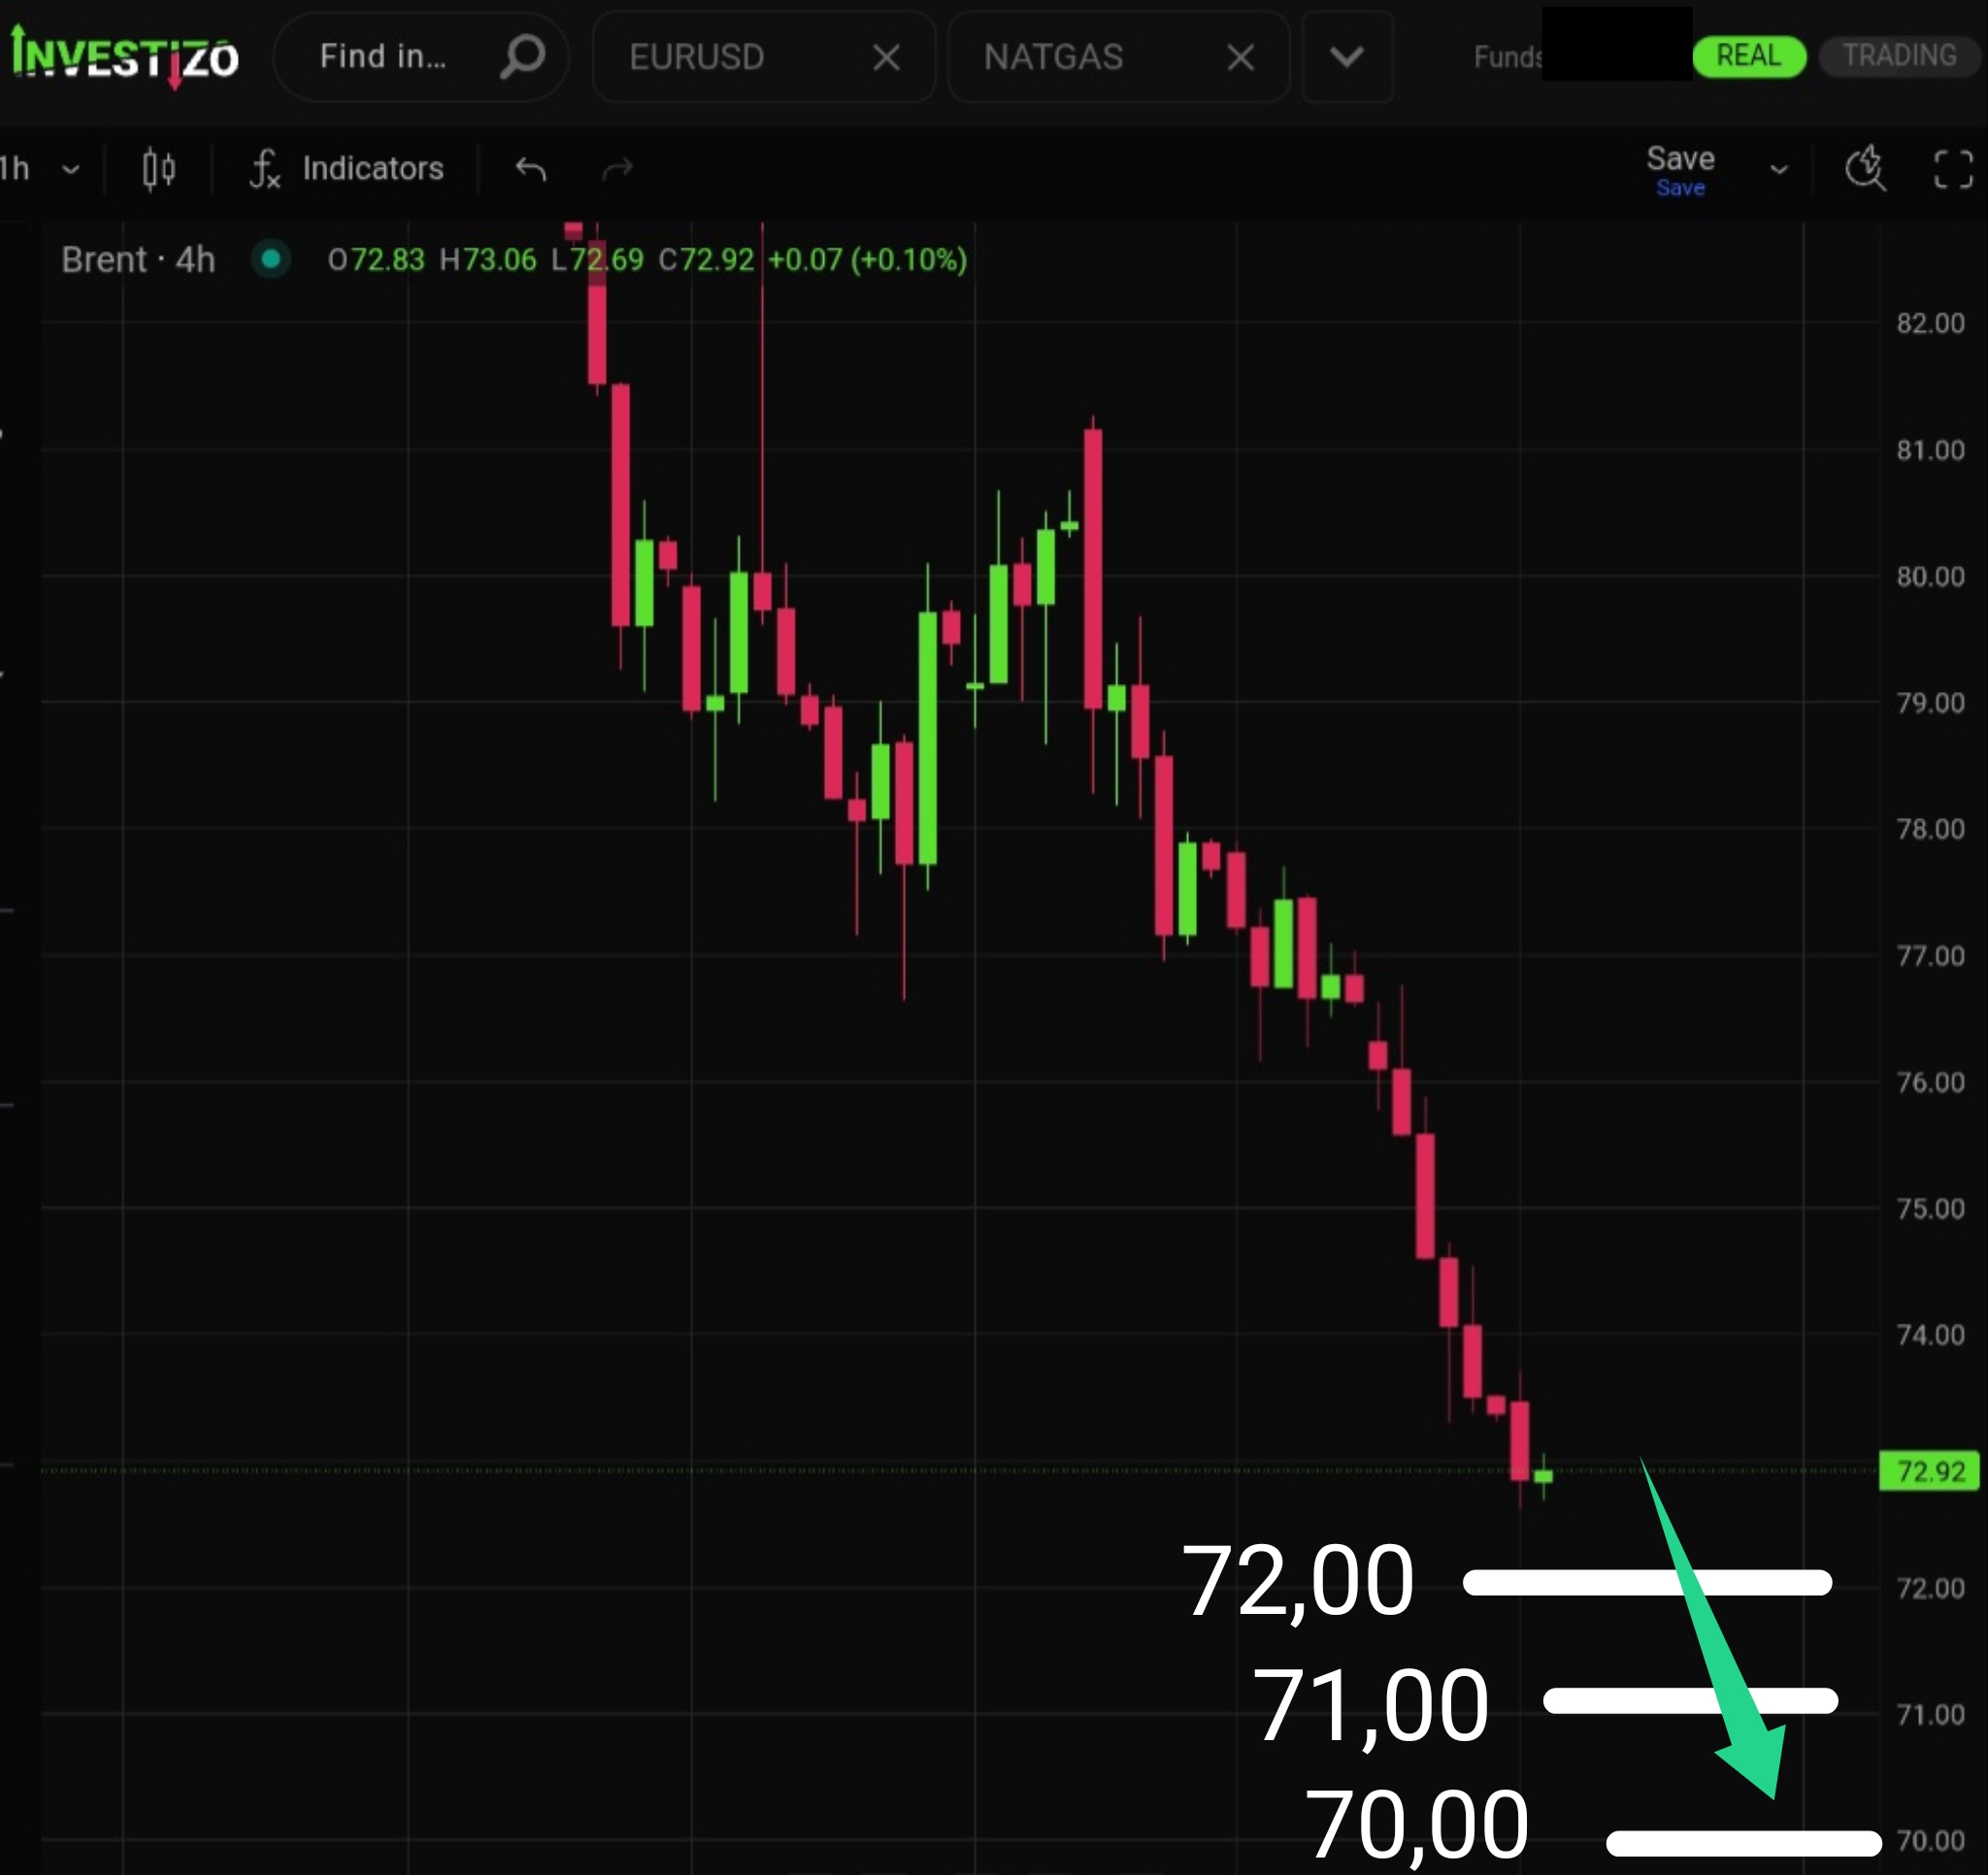
Brent crude has dropped to $72.92 per barrel as the market prices out the last of the Iranian risk premium.
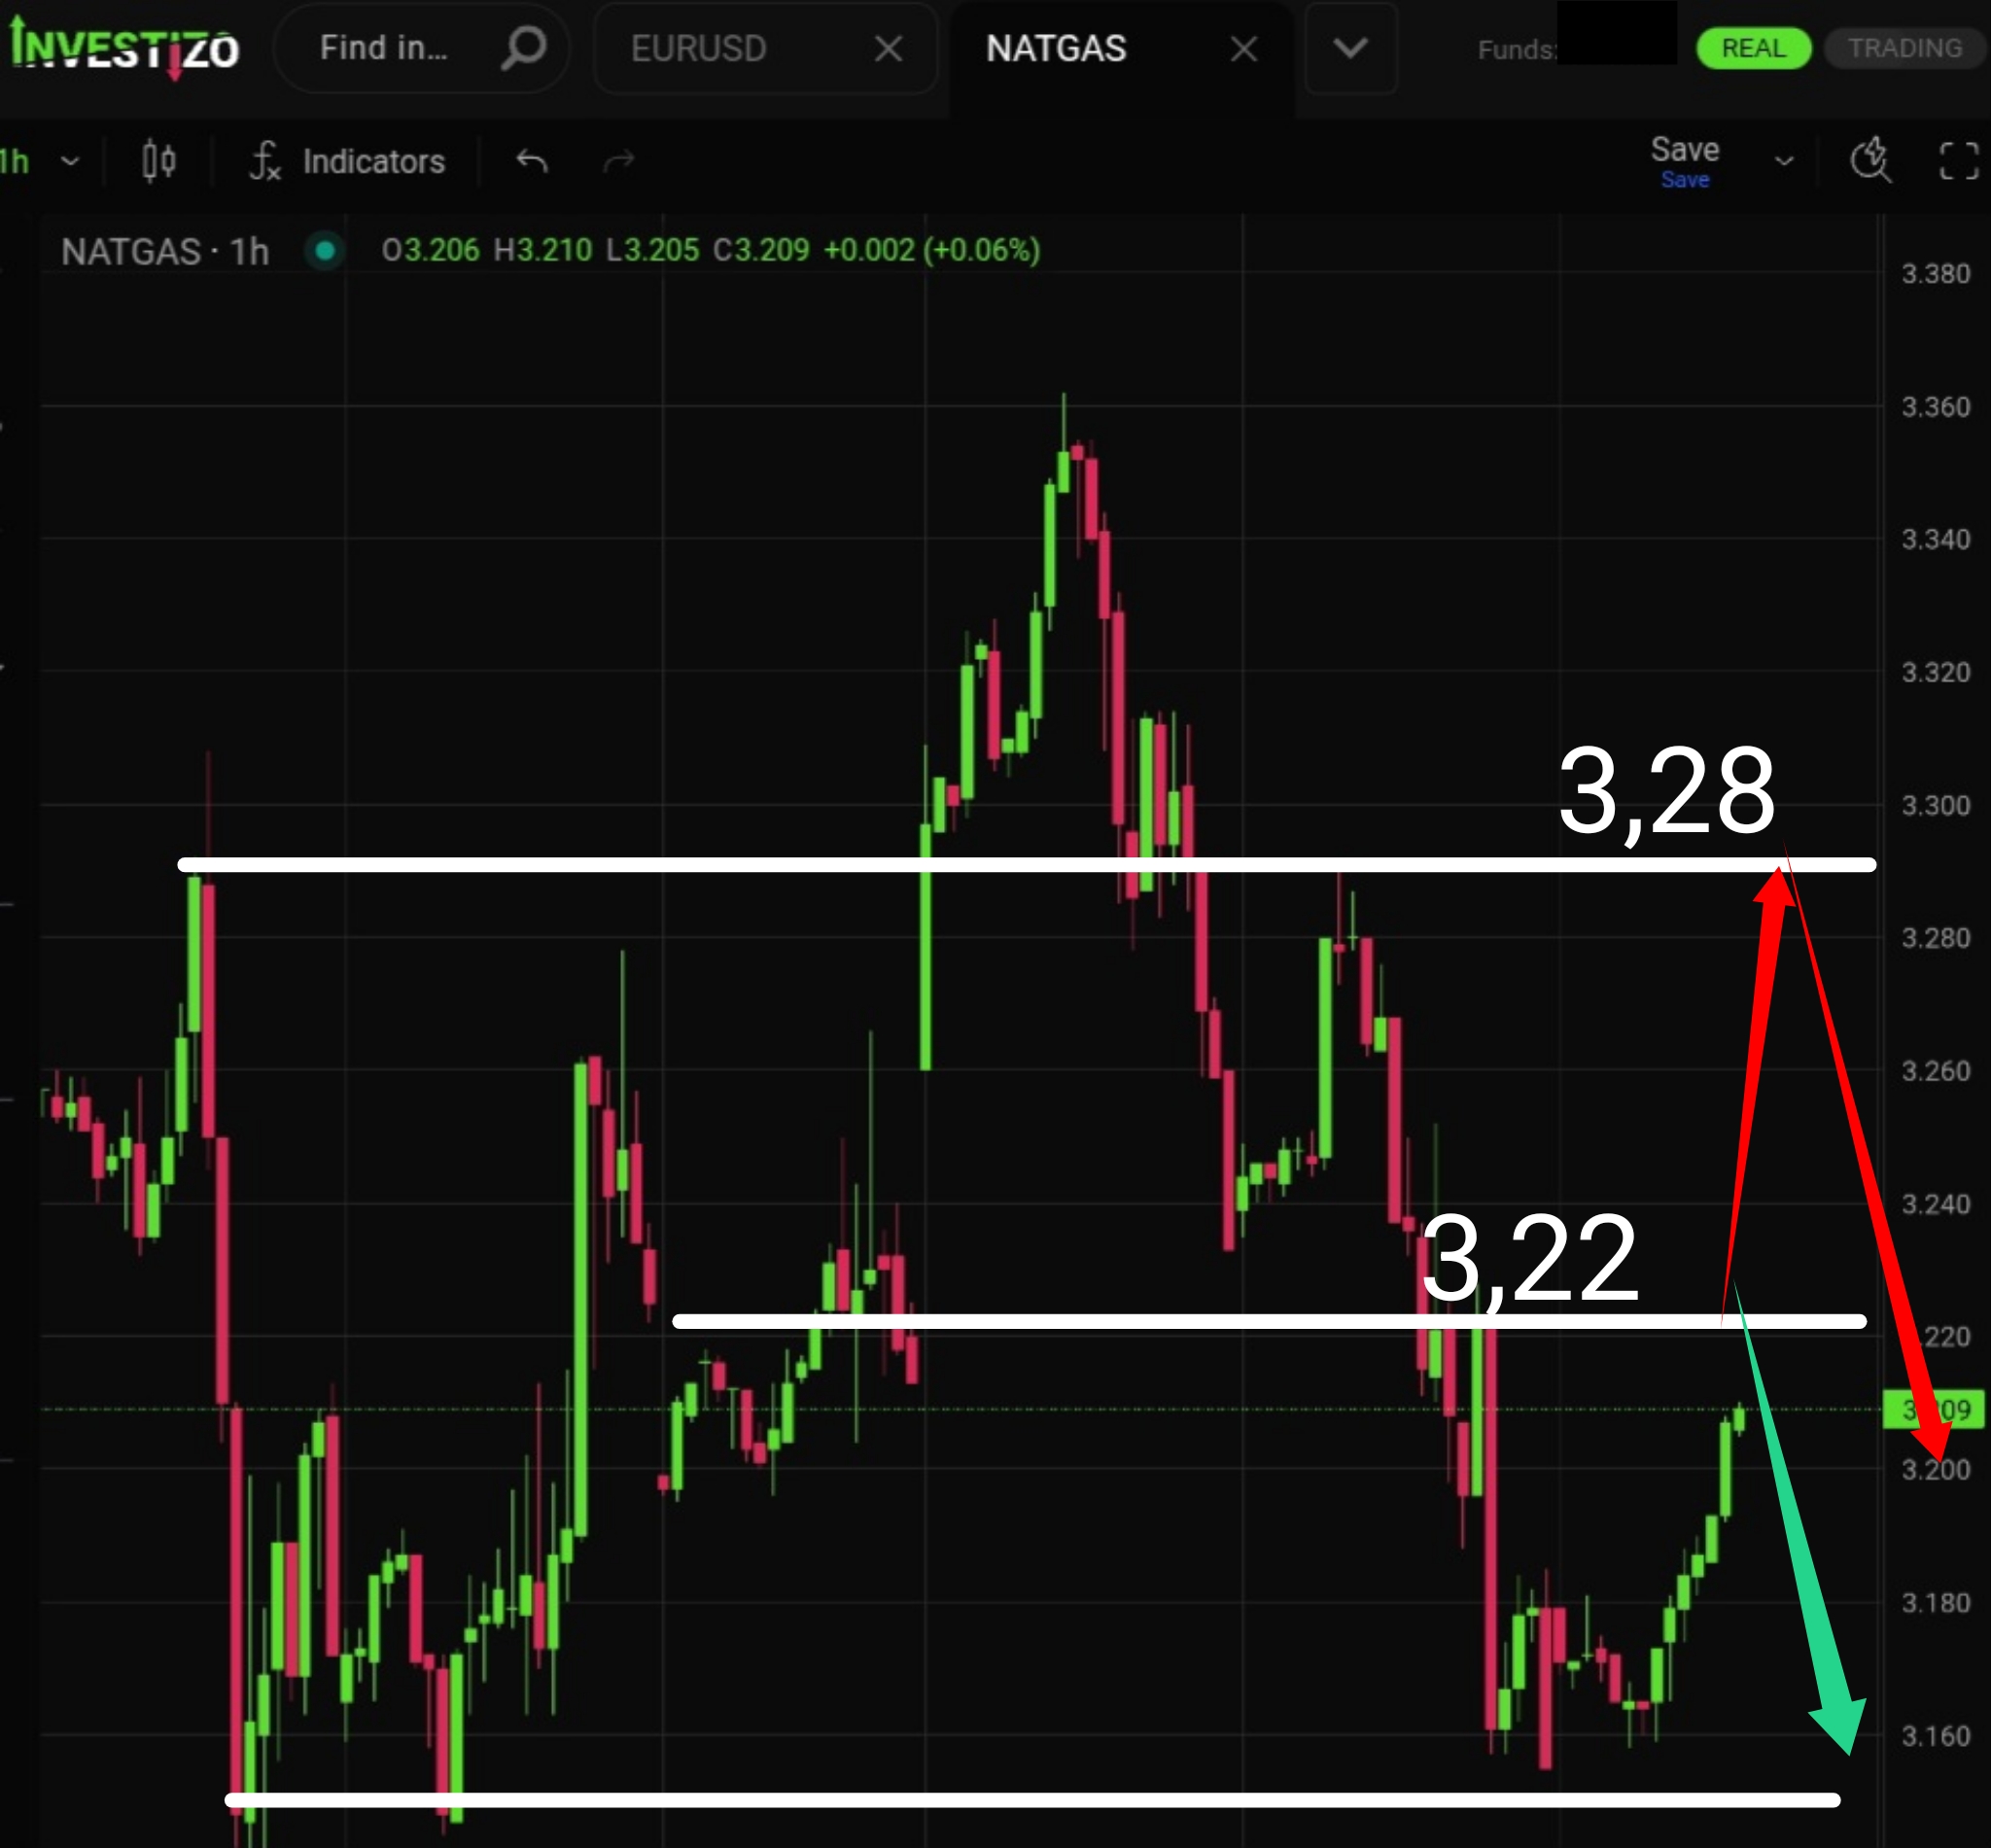
Natural gas has found support near the 3.15 zone and has moved into another corrective rebound.